The Hartford 2009 Annual Report Download - page 40
Download and view the complete annual report
Please find page 40 of the 2009 The Hartford annual report below. You can navigate through the pages in the report by either clicking on the pages listed below, or by using the keyword search tool below to find specific information within the annual report.-
 1
1 -
2
-
3
-
4
-
5
-
6
-
7
-
8
-
9
-
10
-
11
-
12
-
13
-
14
-
15
-
16
-
17
-
18
-
19
-
20
-
21
-
22
-
23
-
24
-
25
-
26
-
27
-
28
-
29
-
 30
30 -
 31
31 -
 32
32 -
 33
33 -
 34
34 -
 35
35 -
 36
36 -
 37
37 -
 38
38 -
 39
39 -
 40
40 -
 41
41 -
 42
42 -
 43
43 -
 44
44 -
 45
45 -
 46
46 -
 47
47 -
 48
48 -
 49
49 -
 50
50 -
51
-
52
-
53
-
54
-
55
-
56
-
57
-
58
-
59
-
60
-
61
-
62
-
63
-
64
-
65
-
66
-
67
-
68
-
69
-
70
-
71
-
72
-
73
-
74
-
75
-
76
-
77
-
78
-
79
-
80
-
81
-
82
-
83
-
84
-
85
-
86
-
87
-
88
-
89
-
90
-
91
-
92
-
93
-
94
-
95
-
96
-
97
-
98
-
99
-
100
-
101
-
102
-
103
-
104
-
105
-
106
-
107
-
108
-
109
-
110
-
111
-
112
-
113
-
114
-
115
-
116
-
117
-
118
-
119
-
120
-
121
-
122
-
123
-
124
-
125
-
126
-
127
-
128
-
129
-
130
-
131
-
132
-
133
-
134
-
135
-
136
-
137
-
138
-
139
-
140
-
141
-
142
-
143
-
144
-
145
-
146
-
147
-
148
-
149
-
150
-
151
-
152
-
153
-
154
-
155
-
156
-
157
-
158
-
159
-
160
-
161
-
162
-
163
-
164
-
165
-
166
-
167
-
168
-
169
-
170
-
171
-
172
-
173
-
174
-
175
-
176
-
177
-
178
-
179
-
180
-
181
-
182
-
183
-
184
-
185
-
186
-
187
-
188
-
189
-
190
-
191
-
192
-
193
-
194
-
195
-
196
-
197
-
198
-
199
-
200
-
201
-
202
-
203
-
204
-
205
-
206
-
207
-
208
-
209
-
210
-
211
-
212
-
213
-
214
-
215
-
216
-
217
-
218
-
219
-
220
-
221
-
222
-
223
-
224
-
225
-
226
-
227
-
228
-
229
-
230
-
231
-
232
-
233
-
234
-
235
-
236
-
237
-
238
-
239
-
240
-
241
-
242
-
243
-
244
-
245
-
246
-
247
-
248
-
249
-
250
-
251
-
252
-
253
-
254
-
255
-
256
-
257
-
258
-
259
-
260
-
261
-
262
-
263
-
264
-
265
-
266
-
267
 |
 |

40
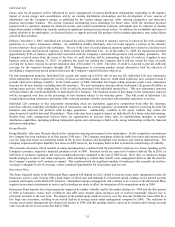
The Hartford, like other insurance companies, categorizes and tracks its insurance reserves for its segments by “line of business”.
Furthermore, The Hartford regularly reviews the appropriateness of reserve levels at the line of business level, taking into consideration
the variety of trends that impact the ultimate settlement of claims for the subsets of claims in each particular line of business. In
addition, within the Other Operations segment, the Company has reserves for asbestos and environmental (“A&E”) claims.
Adjustments to previously established reserves, which may be material, are reflected in the operating results of the period in which the
adjustment is determined to be necessary. In the judgment of management, information currently available has been properly
considered in the reserves established for losses and loss adjustment expenses.
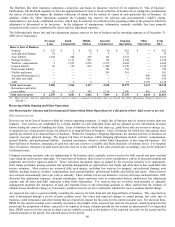
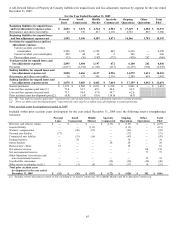
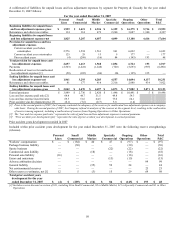
The following table shows loss and loss adjustment expense reserves by line of business and by operating segment as of December 31,
2009, net of reinsurance:
Personal
Lines
Small
Commercial
Middle
Market
Specialty
Commercial
Ongoing
Operations
Other
Operations
Total
P&C
Reserve Line of Business
Property $ 323 $ 2 $ 42 $ 56 $ 423 $ — $ 423
Auto physical damage 16 5 5 9 35 — 35
Auto liability 1,674 248 238 161 2,321 — 2,321
Package business — 1,131 881 136 2,148 — 2,148
Workers’ compensation 9 1,933 2,270 2,272 6,484 — 6,484
General liability 26 145 693 1,286 2,150 — 2,150
Professional liability — — — 742 742 — 742
Fidelity and surety — — — 261 261 — 261
Assumed Reinsurance [1] — — — — — 496 496
All other non-A&E — — — — — 936 936
A&E 2 2 8 3 15 2,199 2,214
Total reserves-net 2,050 3,466 4,137 4,926 14,579 3,631 18,210
Reinsurance and other
recoverables
20
137
305
2,118
2,580
861
3,441
Total reserves-gross $ 2,070 $ 3,603 $ 4,442 $ 7,044 $ 17,159 $ 4,492 $ 21,651
[1] These net loss and loss adjustment expense reserves relate to assumed reinsurance that was moved into Other Operations (formerly known as
“HartRe”).
Reserving within Ongoing and Other Operations
(See Reserving for Asbestos and Environmental Claims within Other Operations for a discussion of how A&E reserves are set)
How reserves are set
Reserves are set by line of business within the various operating segments. A single line of business may be written in more than one
segment. Case reserves are established by a claims handler on each individual claim and are adjusted as new information becomes
known during the course of handling the claim. Lines of business for which loss data (e.g., paid losses and case reserves) emerge (i.e.,
is reported) over a long period of time are referred to as long-tail lines of business. Lines of business for which loss data emerge more
quickly are referred to as short-tail lines of business. Within the Company’ s Ongoing Operations, the shortest-tail lines of business are
property and auto physical damage. The longest tail lines of business within Ongoing Operations include workers’ compensation,
general liability, and professional liability. Assumed reinsurance, which is within Other Operations, is also long-tail business. For
short-tail lines of business, emergence of paid loss and case reserves is credible and likely indicative of ultimate losses. For long-tail
lines of business, emergence of paid losses and case reserves is less credible in the early periods and, accordingly, may not be indicative
of ultimate losses.
Company reserving actuaries, who are independent of the business units, regularly review reserves for both current and prior accident
years using the most current claim data. For most lines of business, these reserve reviews incorporate a variety of actuarial methods and
judgments and involve rigorous analysis. These selections incorporate input, as judged by the reserving actuaries to be appropriate,
from claims personnel, pricing actuaries and operating management on reported loss cost trends and other factors that could affect the
reserve estimates. Most reserves are reviewed fully each quarter, including loss reserves for property, auto physical damage, auto
liability, package business, workers’ compensation, most general liability, professional liability and fidelity and surety. Other reserves
are reviewed semi-annually (twice per year) or annually. These include, but are not limited to, reserves for losses incurred before 1989,
allocated loss adjustment expenses, assumed reinsurance, latent exposures such as construction defects, unallocated loss adjustment
expense and all other non-A&E exposures within Other Operations. For reserves that are reviewed semi-annually or annually,
management monitors the emergence of paid and reported losses in the intervening quarters to either confirm that the estimate of
ultimate losses should not change or, if necessary, perform a reserve review to determine whether the reserve estimate should change.
An expected loss ratio is used in initially recording the reserves for both short-tail and long-tail lines of business. This expected loss
ratio is determined through a review of prior accident years’ loss ratios and expected changes to earned pricing, loss costs, mix of
business, ceded reinsurance and other factors that are expected to impact the loss ratio for the current accident year. For short-tail lines,
IBNR for the current accident year is initially recorded as the product of the expected loss ratio for the period, earned premium for the
period and the proportion of losses expected to be reported in future calendar periods for the current accident period. For long-tailed
lines, IBNR reserves for the current accident year are initially recorded as the product of the expected loss ratio for the period and the
earned premium for the period, less reported losses for the period.