The Hartford 2009 Annual Report Download - page 120
Download and view the complete annual report
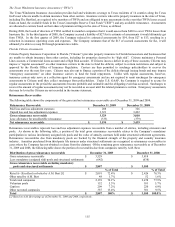
Please find page 120 of the 2009 The Hartford annual report below. You can navigate through the pages in the report by either clicking on the pages listed below, or by using the keyword search tool below to find specific information within the annual report.-
 1
1 -
2
-
3
-
4
-
5
-
6
-
7
-
8
-
9
-
10
-
11
-
12
-
13
-
14
-
15
-
16
-
17
-
18
-
19
-
20
-
21
-
22
-
23
-
24
-
25
-
26
-
27
-
28
-
29
-
30
-
31
-
32
-
33
-
34
-
35
-
36
-
37
-
38
-
39
-
40
-
41
-
42
-
43
-
44
-
45
-
46
-
47
-
48
-
49
-
50
-
51
-
52
-
53
-
54
-
55
-
56
-
57
-
58
-
59
-
60
-
61
-
62
-
63
-
64
-
65
-
66
-
67
-
68
-
69
-
70
-
71
-
72
-
73
-
74
-
75
-
76
-
77
-
78
-
79
-
80
-
81
-
82
-
83
-
84
-
85
-
86
-
87
-
88
-
89
-
90
-
91
-
92
-
93
-
94
-
95
-
96
-
97
-
98
-
99
-
100
-
101
-
102
-
103
-
104
-
105
-
106
-
107
-
108
-
109
-
 110
110 -
 111
111 -
 112
112 -
 113
113 -
 114
114 -
 115
115 -
 116
116 -
 117
117 -
 118
118 -
 119
119 -
 120
120 -
 121
121 -
 122
122 -
 123
123 -
 124
124 -
 125
125 -
 126
126 -
 127
127 -
 128
128 -
 129
129 -
 130
130 -
131
-
132
-
133
-
134
-
135
-
136
-
137
-
138
-
139
-
140
-
141
-
142
-
143
-
144
-
145
-
146
-
147
-
148
-
149
-
150
-
151
-
152
-
153
-
154
-
155
-
156
-
157
-
158
-
159
-
160
-
161
-
162
-
163
-
164
-
165
-
166
-
167
-
168
-
169
-
170
-
171
-
172
-
173
-
174
-
175
-
176
-
177
-
178
-
179
-
180
-
181
-
182
-
183
-
184
-
185
-
186
-
187
-
188
-
189
-
190
-
191
-
192
-
193
-
194
-
195
-
196
-
197
-
198
-
199
-
200
-
201
-
202
-
203
-
204
-
205
-
206
-
207
-
208
-
209
-
210
-
211
-
212
-
213
-
214
-
215
-
216
-
217
-
218
-
219
-
220
-
221
-
222
-
223
-
224
-
225
-
226
-
227
-
228
-
229
-
230
-
231
-
232
-
233
-
234
-
235
-
236
-
237
-
238
-
239
-
240
-
241
-
242
-
243
-
244
-
245
-
246
-
247
-
248
-
249
-
250
-
251
-
252
-
253
-
254
-
255
-
256
-
257
-
258
-
259
-
260
-
261
-
262
-
263
-
264
-
265
-
266
-
267
 |
 |

120
Financial Services
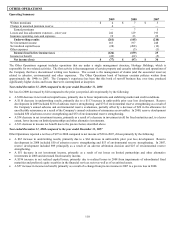
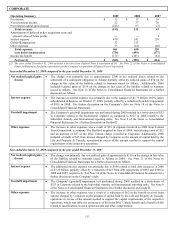
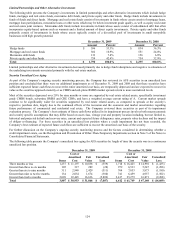
Several positive developments occurred in the financial services sectors during the second half of 2009. Earnings for large domestic
banks surpassed expectations and losses for banks that underwent the Supervisory Capital Assessment Program (“SCAP”), or stress test,
were less than the Federal Reserve’ s projections. Unrealized losses on banks’ investment portfolios decreased as credit spreads
tightened and the pace of deterioration of the credit quality of certain assets slowed. Banks and insurance firms were also able to access
re-opened debt capital markets, reducing their dependence on government guarantee programs and enhancing their liquidity positions.
In addition, certain financial institutions were able to improve their junior capital ratios through common equity capital raises,
exchanges and tenders. Despite these positive developments, financial services companies continue to face a difficult macroeconomic
environment and regulatory uncertainty which could affect future earnings.
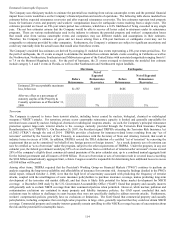
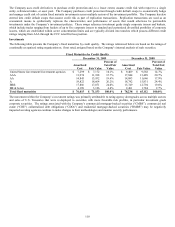
The Company has exposure to the financial services sector predominantly through banking and insurance firms. The following table
presents the Company’ s exposure to the financial services sector included in the AFS Securities by Type table above. A comparison of
fair value to amortized cost is not indicative of the pricing of individual securities as impairments have occurred.
December 31, 2009 December 31, 2008
Amortized
Cost
Fair Value
Percent of
Total Fair
Value
Amortized
Cost
Fair Value
Percent of
Total Fair
Value
AAA $ 299 $ 290 3.7% $ 728 $ 628 7.9%
AA 1,913 1,867 23.5% 2,067 1,780 22.5%
A 4,510 3,987 50.2% 5,479 4,606 58.1%
BBB 1,664 1,379 17.4% 1,015 816 10.3%
BB & below 509 416 5.2% 106 93 1.2%
Total [1] $ 8,895 $ 7,939 100.0% $ 9,395 $ 7,923 100.0%
[1] The credit qualities above include downgrades that have shifted the portfolio from higher rated assets to lower rated assets since December 31,
2008.
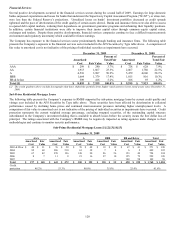
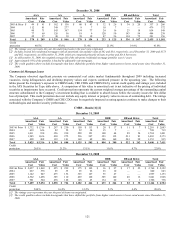
Sub-Prime Residential Mortgage Loans
The following table presents the Company’ s exposure to RMBS supported by sub-prime mortgage loans by current credit quality and
vintage year included in the AFS Securities by Type table above. These securities have been affected by deterioration in collateral
performance caused by declining home prices and continued macroeconomic pressures including higher unemployment levels. A
comparison of fair value to amortized cost is not indicative of the pricing of individual securities as impairments have occurred. Credit
protection represents the current weighted average percentage, excluding wrapped securities, of the outstanding capital structure
subordinated to the Company’ s investment holding that is available to absorb losses before the security incurs the first dollar loss of
principal. The ratings associated with the Company’ s RMBS may be negatively impacted as rating agencies make changes to their
methodologies and continue to monitor security performance.
Sub-Prime Residential Mortgage Loans [1] [2] [3] [4] [5]
December 31, 2009
AAA AA A BBB
BB and Below Total
Amortized
Cost
Fair
Value
Amortized
Cost
Fair
Value
Amortized
Cost
Fair
Value
Amortized
Cost
Fair
Value
Amortized
Cost
Fair
Value
Amortized
Cost
Fair
Value
2003 & Prior $ 40 $ 31 $ 76 $ 58 $ 70 $ 48 $ 18 $ 12 $ 67 $ 41 $ 271 $ 190
2004 82 68 286 210 61 38 7 4 6 2 442 322
2005 67 42 270 196 148 90 86 26 153 40 724 394
2006 8 7 11 8 21 16 27 10 155 79 222 120
2007 — — — — — — — — 109 58 109 58
Total $ 197 $ 148 $ 643 $ 472 $ 300 $ 192 $ 138 $ 52 $ 490 $ 220 $ 1,768 $ 1,084
Credit
protection 48.2% 53.3% 40.6% 35.8% 25.4% 41.6%