The Hartford 2009 Annual Report Download - page 38
Download and view the complete annual report
Please find page 38 of the 2009 The Hartford annual report below. You can navigate through the pages in the report by either clicking on the pages listed below, or by using the keyword search tool below to find specific information within the annual report.-
 1
1 -
2
-
3
-
4
-
5
-
6
-
7
-
8
-
9
-
10
-
11
-
12
-
13
-
14
-
15
-
16
-
17
-
18
-
19
-
20
-
21
-
22
-
23
-
24
-
25
-
26
-
27
-
 28
28 -
 29
29 -
 30
30 -
 31
31 -
 32
32 -
 33
33 -
 34
34 -
 35
35 -
 36
36 -
 37
37 -
 38
38 -
 39
39 -
 40
40 -
 41
41 -
 42
42 -
 43
43 -
 44
44 -
 45
45 -
 46
46 -
 47
47 -
 48
48 -
49
-
50
-
51
-
52
-
53
-
54
-
55
-
56
-
57
-
58
-
59
-
60
-
61
-
62
-
63
-
64
-
65
-
66
-
67
-
68
-
69
-
70
-
71
-
72
-
73
-
74
-
75
-
76
-
77
-
78
-
79
-
80
-
81
-
82
-
83
-
84
-
85
-
86
-
87
-
88
-
89
-
90
-
91
-
92
-
93
-
94
-
95
-
96
-
97
-
98
-
99
-
100
-
101
-
102
-
103
-
104
-
105
-
106
-
107
-
108
-
109
-
110
-
111
-
112
-
113
-
114
-
115
-
116
-
117
-
118
-
119
-
120
-
121
-
122
-
123
-
124
-
125
-
126
-
127
-
128
-
129
-
130
-
131
-
132
-
133
-
134
-
135
-
136
-
137
-
138
-
139
-
140
-
141
-
142
-
143
-
144
-
145
-
146
-
147
-
148
-
149
-
150
-
151
-
152
-
153
-
154
-
155
-
156
-
157
-
158
-
159
-
160
-
161
-
162
-
163
-
164
-
165
-
166
-
167
-
168
-
169
-
170
-
171
-
172
-
173
-
174
-
175
-
176
-
177
-
178
-
179
-
180
-
181
-
182
-
183
-
184
-
185
-
186
-
187
-
188
-
189
-
190
-
191
-
192
-
193
-
194
-
195
-
196
-
197
-
198
-
199
-
200
-
201
-
202
-
203
-
204
-
205
-
206
-
207
-
208
-
209
-
210
-
211
-
212
-
213
-
214
-
215
-
216
-
217
-
218
-
219
-
220
-
221
-
222
-
223
-
224
-
225
-
226
-
227
-
228
-
229
-
230
-
231
-
232
-
233
-
234
-
235
-
236
-
237
-
238
-
239
-
240
-
241
-
242
-
243
-
244
-
245
-
246
-
247
-
248
-
249
-
250
-
251
-
252
-
253
-
254
-
255
-
256
-
257
-
258
-
259
-
260
-
261
-
262
-
263
-
264
-
265
-
266
-
267
 |
 |
38
Specialty Commercial
Within Specialty Commercial, management expects written premiums to be slightly higher in 2010, primarily due to higher casualty
premiums, partially offset by the impact of business and economic changes experienced in 2009. Written premiums decreased by 17%
in 2009, due to a combination of the sale of First State Management Group, the effects of the economic downturn, ratings concerns, and
market-driven changes in a reinsurance arrangement. The Company sold its core excess and surplus lines property businesses in March
2009. Additionally, as with other commercial lines segments, Specialty Commercial experienced the same negative impacts of the
recession on written premiums. And, while the Company’ s ratings stabilized in May of 2009, concerns about the Company’ s financial
strength to that point had a negative effect on commercial directors’ and officers’ and contract surety lines of business. Lastly, the
reinsurance program for the professional liability lines renewed in July 2009 with a change in structure from primarily an excess of loss
program to a variable quota share arrangement. This change was market driven and consistent with the Company’ s expectations. This
will have the impact of depressing the net written premium growth for professional liability through the second quarter of 2010.
For professional liability business within Specialty Commercial, the Company expects its losses from the fallout of the sub-prime
mortgage market and the broader credit crisis to be manageable based on several factors. Principal among them is the diversified nature
of the Company’ s product and customer portfolio, with a majority of the Company’ s total in-force professional liability net written
premium derived from policyholders with privately-held ownership and, therefore, relatively low shareholder class action exposure.
Reinsurance substantially mitigates the net limits exposed per policy and no single industry segment comprises 15% or more of the
Company’ s professional liability book of business by net written premium. About half of the Company’ s limits exposed to federal
shareholder class action claims filed in 2008 and 2009 are under Side-A D&O insurance policies that provide protection to individual
directors and officers only in cases where their company cannot indemnify them. In addition, 88% of the exposed limits are on excess
policies rather than primary policies. Regarding the Madoff and Stanford alleged fraud cases which continue to evolve, based on a
detailed ground-up review of all claims notices received to date and an analysis of potentially involved parties noted in press reports, the
Company anticipates only a limited number of its policies and corresponding net limits to be exposed. The Company expects its losses
from the sub-prime mortgage and credit crisis, as well as its exposure to the Madoff and Stanford cases, to be within its expected loss
estimates.
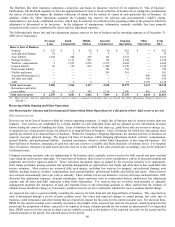
In 2010, the combined ratio before catastrophes and prior accident year development for Specialty Commercial is expected to be slightly
higher than the 100.1 experienced in 2009 due to an expected increase in the current accident year loss and loss adjustment expense ratio
and the dividend ratio, partially offset by a decrease in the expense ratio.
Investment Income
Property & Casualty net investment income is expected to be more favorable in 2010 than in 2009 due to increased allocation of liquid
investments to spread based investments, such as investment grade corporate bonds, and more favorable limited partnership results.