The Hartford 2009 Annual Report Download - page 95
Download and view the complete annual report
Please find page 95 of the 2009 The Hartford annual report below. You can navigate through the pages in the report by either clicking on the pages listed below, or by using the keyword search tool below to find specific information within the annual report.-
 1
1 -
2
-
3
-
4
-
5
-
6
-
7
-
8
-
9
-
10
-
11
-
12
-
13
-
14
-
15
-
16
-
17
-
18
-
19
-
20
-
21
-
22
-
23
-
24
-
25
-
26
-
27
-
28
-
29
-
30
-
31
-
32
-
33
-
34
-
35
-
36
-
37
-
38
-
39
-
40
-
41
-
42
-
43
-
44
-
45
-
46
-
47
-
48
-
49
-
50
-
51
-
52
-
53
-
54
-
55
-
56
-
57
-
58
-
59
-
60
-
61
-
62
-
63
-
64
-
65
-
66
-
67
-
68
-
69
-
70
-
71
-
72
-
73
-
74
-
75
-
76
-
77
-
78
-
79
-
80
-
81
-
82
-
83
-
84
-
 85
85 -
 86
86 -
 87
87 -
 88
88 -
 89
89 -
 90
90 -
 91
91 -
 92
92 -
 93
93 -
 94
94 -
 95
95 -
 96
96 -
 97
97 -
 98
98 -
 99
99 -
 100
100 -
 101
101 -
 102
102 -
 103
103 -
 104
104 -
 105
105 -
106
-
107
-
108
-
109
-
110
-
111
-
112
-
113
-
114
-
115
-
116
-
117
-
118
-
119
-
120
-
121
-
122
-
123
-
124
-
125
-
126
-
127
-
128
-
129
-
130
-
131
-
132
-
133
-
134
-
135
-
136
-
137
-
138
-
139
-
140
-
141
-
142
-
143
-
144
-
145
-
146
-
147
-
148
-
149
-
150
-
151
-
152
-
153
-
154
-
155
-
156
-
157
-
158
-
159
-
160
-
161
-
162
-
163
-
164
-
165
-
166
-
167
-
168
-
169
-
170
-
171
-
172
-
173
-
174
-
175
-
176
-
177
-
178
-
179
-
180
-
181
-
182
-
183
-
184
-
185
-
186
-
187
-
188
-
189
-
190
-
191
-
192
-
193
-
194
-
195
-
196
-
197
-
198
-
199
-
200
-
201
-
202
-
203
-
204
-
205
-
206
-
207
-
208
-
209
-
210
-
211
-
212
-
213
-
214
-
215
-
216
-
217
-
218
-
219
-
220
-
221
-
222
-
223
-
224
-
225
-
226
-
227
-
228
-
229
-
230
-
231
-
232
-
233
-
234
-
235
-
236
-
237
-
238
-
239
-
240
-
241
-
242
-
243
-
244
-
245
-
246
-
247
-
248
-
249
-
250
-
251
-
252
-
253
-
254
-
255
-
256
-
257
-
258
-
259
-
260
-
261
-
262
-
263
-
264
-
265
-
266
-
267
 |
 |

95
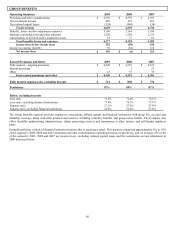
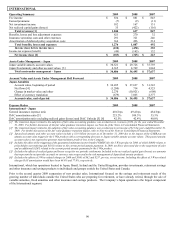
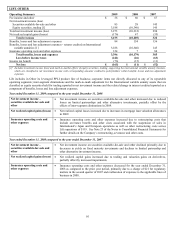
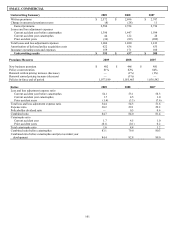
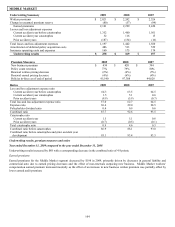
LIFE OTHER
Operating Summary 2009 2008 2007
Fee income and other $ 58 $ 60 $67
Net investment income (loss)
Securities available-for-sale and other 85 28 145
Equity securities, trading [1] 3,188 (10,340) 145
Total net investment income (loss) 3,273 (10,312) 290
Net realized capital gains (losses) (176) 47 (35)
Total revenues 3,155 (10,205) 322
Benefits, losses and loss adjustment expenses 84 154 156
Benefits, losses and loss adjustment expenses - returns credited on International
variable annuities [1] 3,188
(10,340) 145
Insurance operating costs and other expenses 124 7 84
Total benefits, losses and expenses 3,396 (10,179) 385
Loss before income taxes (241) (26) (63)
Income tax benefit (76) (15) (11)
Net loss $ (165) $(11) $(52)
[1] Includes investment income (loss) and mark-to-market effects of equity securities, trading, supporting the international variable annuity business,
which are classified in net investment income with corresponding amounts credited to policyholders within benefits, losses and loss adjustment
expenses.
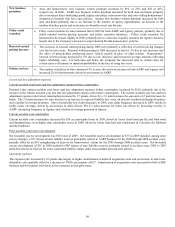
Life includes in Other its leveraged PPLI product line of business; corporate items not directly allocated to any of its reportable
operating segments; inter-segment eliminations and the mark-to-mark adjustment for the International variable annuity assets that are
classified as equity securities held for trading reported in net investment income and the related change in interest credited reported as a
component of benefits, losses and loss adjustment expenses.
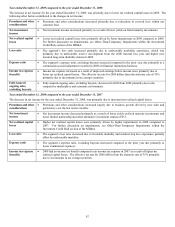
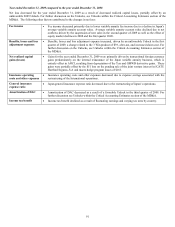
Year ended December 31, 2009 compared to the year ended December 31, 2008
Net investment income –
securities available-for-sale and
other
• Net investment income on securities available-for-sale and other increased due to reduced
losses on limited partnerships and other alternative investments, partially offset by the
effects of inter-segment eliminations in 2009.
Net realized capital gains (losses) • Net realized capital losses increased due to increases in mortgage loan valuation allowances
in 2009.
Insurance operating costs and
other expenses
• Insurance operating costs and other expenses increased due to restructuring costs that
include severance benefits and other costs associated with the suspension of sales in
International’ s Japan and European operations as well as other restructuring costs across
Life operations of $119. See Note 23 of the Notes to Consolidated Financial Statements for
further details on the Company’ s restructuring, severance and other costs.
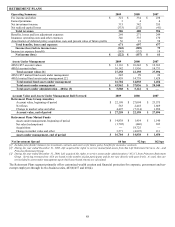
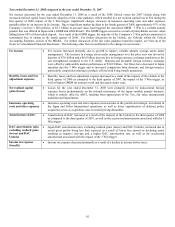
Year ended December 31, 2008 compared to the year ended December 31, 2007
Net investment income –
securities available-for-sale and
other
• Net investment income on securities available-for-sale and other declined primarily due to
decreases in yields on fixed maturity investments and declines in limited partnership and
other alternative investment income.
Net realized capital gains (losses) • Net realized capital gains increased due to trading and valuation gains on derivatives,
partially offset by increased impairments.
Insurance operating costs and
other expenses
• Insurance operating costs and other expenses decreased for the year ended December 31,
2008 as compared to the prior year period, primarily due to a charge of $21 for regulatory
matters in the second quarter of 2007 and reallocation of expenses to the applicable lines of
business in 2008.