The Hartford 2009 Annual Report Download - page 48
Download and view the complete annual report
Please find page 48 of the 2009 The Hartford annual report below. You can navigate through the pages in the report by either clicking on the pages listed below, or by using the keyword search tool below to find specific information within the annual report.-
 1
1 -
2
-
3
-
4
-
5
-
6
-
7
-
8
-
9
-
10
-
11
-
12
-
13
-
14
-
15
-
16
-
17
-
18
-
19
-
20
-
21
-
22
-
23
-
24
-
25
-
26
-
27
-
28
-
29
-
30
-
31
-
32
-
33
-
34
-
35
-
36
-
37
-
 38
38 -
 39
39 -
 40
40 -
 41
41 -
 42
42 -
 43
43 -
 44
44 -
 45
45 -
 46
46 -
 47
47 -
 48
48 -
 49
49 -
 50
50 -
 51
51 -
 52
52 -
 53
53 -
 54
54 -
 55
55 -
 56
56 -
 57
57 -
 58
58 -
59
-
60
-
61
-
62
-
63
-
64
-
65
-
66
-
67
-
68
-
69
-
70
-
71
-
72
-
73
-
74
-
75
-
76
-
77
-
78
-
79
-
80
-
81
-
82
-
83
-
84
-
85
-
86
-
87
-
88
-
89
-
90
-
91
-
92
-
93
-
94
-
95
-
96
-
97
-
98
-
99
-
100
-
101
-
102
-
103
-
104
-
105
-
106
-
107
-
108
-
109
-
110
-
111
-
112
-
113
-
114
-
115
-
116
-
117
-
118
-
119
-
120
-
121
-
122
-
123
-
124
-
125
-
126
-
127
-
128
-
129
-
130
-
131
-
132
-
133
-
134
-
135
-
136
-
137
-
138
-
139
-
140
-
141
-
142
-
143
-
144
-
145
-
146
-
147
-
148
-
149
-
150
-
151
-
152
-
153
-
154
-
155
-
156
-
157
-
158
-
159
-
160
-
161
-
162
-
163
-
164
-
165
-
166
-
167
-
168
-
169
-
170
-
171
-
172
-
173
-
174
-
175
-
176
-
177
-
178
-
179
-
180
-
181
-
182
-
183
-
184
-
185
-
186
-
187
-
188
-
189
-
190
-
191
-
192
-
193
-
194
-
195
-
196
-
197
-
198
-
199
-
200
-
201
-
202
-
203
-
204
-
205
-
206
-
207
-
208
-
209
-
210
-
211
-
212
-
213
-
214
-
215
-
216
-
217
-
218
-
219
-
220
-
221
-
222
-
223
-
224
-
225
-
226
-
227
-
228
-
229
-
230
-
231
-
232
-
233
-
234
-
235
-
236
-
237
-
238
-
239
-
240
-
241
-
242
-
243
-
244
-
245
-
246
-
247
-
248
-
249
-
250
-
251
-
252
-
253
-
254
-
255
-
256
-
257
-
258
-
259
-
260
-
261
-
262
-
263
-
264
-
265
-
266
-
267
 |
 |

48
A portion of the gross incurred loss and loss adjustment expenses are recoverable from reinsurers under the Company’ s principal
catastrophe reinsurance program in addition to other reinsurance programs. Reinsurance recoveries under the Company’ s principal
catastrophe reinsurance program, which covers multiple lines of business, are allocated to the segments in accordance with a pre-
established methodology that is consistent with the method used to allocate the ceded premium to each segment.
The Company’ s estimate of ultimate loss and loss expenses arising from hurricanes and other catastrophes is based on covered losses
under the terms of the policies. The Company does not provide residential flood insurance on its Personal Lines homeowners policies
so the Company’ s estimate of hurricane losses on Personal Lines homeowners business does not include any provision for damages
arising from flood waters. The Company acts as an administrator for the Write Your Own flood program on behalf of the National
Flood Insurance Program under FEMA, for which it earns a fee for collecting premiums and processing claims. Under the program, the
Company services both personal lines and commercial lines flood insurance policies and does not assume any underwriting risk. As a
result, catastrophe losses in the above table do not include any losses related to the Write Your Own flood program.
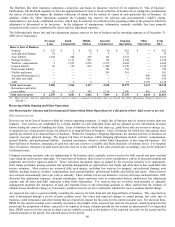
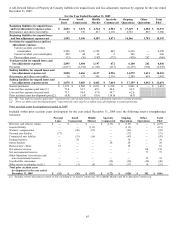
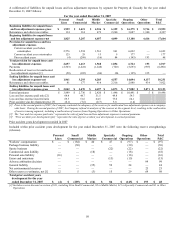
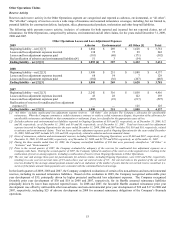
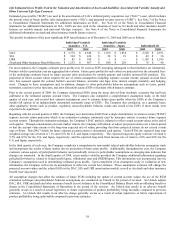
Prior accident years development recorded in 2008
Included within prior accident years development for the year ended December 31, 2008 were the following reserve strengthenings
(releases):
Personal
Lines
Small
Commercial
Middle
Market
Specialty
Commercial
Ongoing
Operations
Other
Operations
Total
P&C
Workers’ compensation $ — $ (92) $ (64) $ — $ (156) $ — $ (156)
General liability — (15) (90) — (105) — (105)
Directors’ and officers’ claims — — — (75) (75) — (75)
Personal auto liability (46) — — — (46) — (46)
Commercial auto liability — — (27) — (27) — (27)
Extra-contractual liability claims
under non-standard personal auto
policies
(24)
—
—
—
(24)
—
(24)
Construction defect claims — — — (10) (10) — (10)
General liability and products
liability
— 17 50 — 67 — 67
National account general liability
allocated loss adjustment expense
reserves
—
—
—
25
25
—
25
Net environmental reserves — — — — — 53 53
Net asbestos reserves — — — — — 50 50
Other reserve re-estimates, net [1] 19 1 (3) (21) (4) 26 22
Total prior accident years
development for the year
ended December 31, 2008
$
(51)
$
(89)
$
(134)
$
(81)
$
(355)
$
129
$
(226)
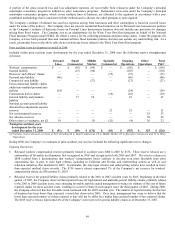
[1] Includes reserve discount accretion of $26, including $6 in Small Commercial, $9 in Middle Market, $8 in Specialty Commercial and $3 in Other
Operations.
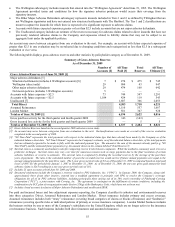
During 2008, the Company’ s re-estimates of prior accident year reserves included the following significant reserve changes:
Ongoing Operations
• Released workers' compensation reserves primarily related to accident years 2000 to 2007 by $156. These reserve releases are a
continuation of favorable developments first recognized in 2005 and recognized in both 2006 and 2007. The reserve releases in
2008 resulted from a determination that workers' compensation losses continue to develop even more favorably from prior
expectations due, in part, to state legal reforms, including in California and Florida, and underwriting actions as well as cost
reduction initiatives first instituted in 2003. In particular, the state legal reforms and underwriting actions have resulted in lower
than expected medical claim severity. The $156 reserve release represented 3% of the Company’ s net reserves for workers’
compensation claims as of December 31, 2007.
• Released reserves for general liability claims primarily related to the 2001 to 2007 accident years by $105. Beginning in the third
quarter of 2007, the Company observed that reported losses for high hazard and umbrella general liability claims, primarily related
to the 2001 to 2006 accident years, were emerging favorably and this caused management to reduce its estimate of the cost of future
reported claims for these accident years, resulting in a reserve release in each quarter since the third quarter of 2007. During 2008,
the Company observed that this favorable trend continued with the 2007 accident year. The number of reported claims for this line
of business has been lower than expected, a trend first observed in 2005. Over time, management has come to believe that the
lower than expected number of claims reported to date will not be offset by a higher than expected number of late reported claims.
The $105 reserve release represented 4% of the Company’ s net reserves for general liability claims as of December 31, 2007.