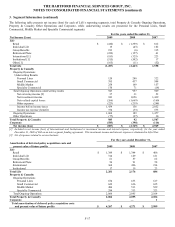
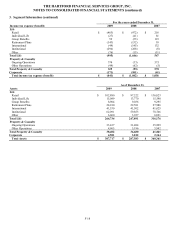
The Hartford 2009 Annual Report Download - page 171
Download and view the complete annual report
Please find page 171 of the 2009 The Hartford annual report below. You can navigate through the pages in the report by either clicking on the pages listed below, or by using the keyword search tool below to find specific information within the annual report.-
 1
1 -
2
-
3
-
4
-
5
-
6
-
7
-
8
-
9
-
10
-
11
-
12
-
13
-
14
-
15
-
16
-
17
-
18
-
19
-
20
-
21
-
22
-
23
-
24
-
25
-
26
-
27
-
28
-
29
-
30
-
31
-
32
-
33
-
34
-
35
-
36
-
37
-
38
-
39
-
40
-
41
-
42
-
43
-
44
-
45
-
46
-
47
-
48
-
49
-
50
-
51
-
52
-
53
-
54
-
55
-
56
-
57
-
58
-
59
-
60
-
61
-
62
-
63
-
64
-
65
-
66
-
67
-
68
-
69
-
70
-
71
-
72
-
73
-
74
-
75
-
76
-
77
-
78
-
79
-
80
-
81
-
82
-
83
-
84
-
85
-
86
-
87
-
88
-
89
-
90
-
91
-
92
-
93
-
94
-
95
-
96
-
97
-
98
-
99
-
100
-
101
-
102
-
103
-
104
-
105
-
106
-
107
-
108
-
109
-
110
-
111
-
112
-
113
-
114
-
115
-
116
-
117
-
118
-
119
-
120
-
121
-
122
-
123
-
124
-
125
-
126
-
127
-
128
-
129
-
130
-
131
-
132
-
133
-
134
-
135
-
136
-
137
-
138
-
139
-
140
-
141
-
142
-
143
-
144
-
145
-
146
-
147
-
148
-
149
-
150
-
151
-
152
-
153
-
154
-
155
-
156
-
157
-
158
-
159
-
160
-
 161
161 -
 162
162 -
 163
163 -
 164
164 -
 165
165 -
 166
166 -
 167
167 -
 168
168 -
 169
169 -
 170
170 -
 171
171 -
 172
172 -
 173
173 -
 174
174 -
 175
175 -
 176
176 -
 177
177 -
 178
178 -
 179
179 -
 180
180 -
 181
181 -
182
-
183
-
184
-
185
-
186
-
187
-
188
-
189
-
190
-
191
-
192
-
193
-
194
-
195
-
196
-
197
-
198
-
199
-
200
-
201
-
202
-
203
-
204
-
205
-
206
-
207
-
208
-
209
-
210
-
211
-
212
-
213
-
214
-
215
-
216
-
217
-
218
-
219
-
220
-
221
-
222
-
223
-
224
-
225
-
226
-
227
-
228
-
229
-
230
-
231
-
232
-
233
-
234
-
235
-
236
-
237
-
238
-
239
-
240
-
241
-
242
-
243
-
244
-
245
-
246
-
247
-
248
-
249
-
250
-
251
-
252
-
253
-
254
-
255
-
256
-
257
-
258
-
259
-
260
-
261
-
262
-
263
-
264
-
265
-
266
-
267
 |
 |
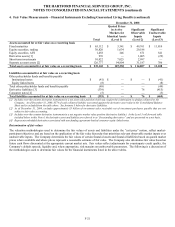
THE HARTFORD FINANCIAL SERVICES GROUP, INC.
NOTES TO CONSOLIDATED FINANCIAL STATEMENTS (continued)
F-22
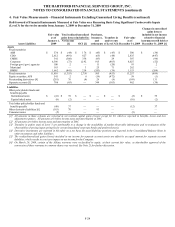
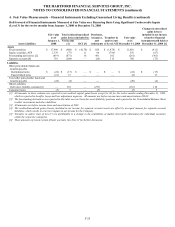
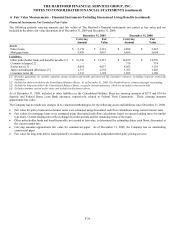
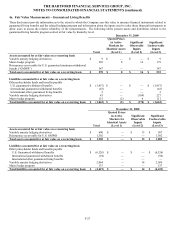
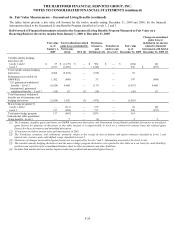
4. Fair Value Measurements – Financial Instruments Excluding Guaranteed Living Benefits (continued)
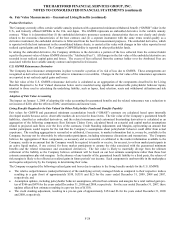
Available-for-Sale Securities and Short-Term Investments
The fair value of AFS securities and short-term investments in an active and orderly market (e.g. not distressed or forced liquidation) is
determined by management after considering one of three primary sources of information: third-party pricing services, independent
broker quotations or pricing matrices. Security pricing is applied using a “waterfall” approach whereby publicly available prices are
first sought from third-party pricing services, the remaining unpriced securities are submitted to independent brokers for prices, or lastly,
securities are priced using a pricing matrix. Typical inputs used by these three pricing methods include, but are not limited to, reported
trades, benchmark yields, issuer spreads, bids, offers, and/or estimated cash flows and prepayments speeds. Based on the typical trading
volumes and the lack of quoted market prices for fixed maturities, third-party pricing services will normally derive the security prices
from recent reported trades for identical or similar securities making adjustments through the reporting date based upon available market
observable information as outlined above. If there are no recent reported trades, the third-party pricing services and brokers may use
matrix or model processes to develop a security price where future cash flow expectations are developed based upon collateral
performance and discounted at an estimated market rate. Included in the pricing of ABS and RMBS are estimates of the rate of future
prepayments of principal over the remaining life of the securities. Such estimates are derived based on the characteristics of the
underlying structure and prepayment speeds previously experienced at the interest rate levels projected for the underlying collateral.
Actual prepayment experience may vary from these estimates.
Prices from third-party pricing services are often unavailable for securities that are rarely traded or are traded only in privately
negotiated transactions. As a result, certain securities are priced via independent broker quotations which utilize inputs that may be
difficult to corroborate with observable market based data. Additionally, the majority of these independent broker quotations are non-
binding. A pricing matrix is used to price securities for which the Company is unable to obtain either a price from a third-party pricing
service or an independent broker quotation, by discounting the expected future cash flows from the security by a developed market
discount rate utilizing current credit spreads. Credit spreads are developed each month using market based data for public securities
adjusted for credit spread differentials between public and private securities which are obtained from a survey of multiple private
placement brokers.
The Company performs a monthly analysis of the prices and credit spreads received from third parties to ensure that the prices represent
a reasonable estimate of the fair value. As a part of this analysis, the Company considers trading volume and other factors to determine
whether the decline in market activity is significant when compared to normal activity in an active market, and if so, whether
transactions may not be orderly considering the weight of available evidence. If the available evidence indicates that pricing is based
upon transactions that are stale or not orderly, the Company places little, if any, weight on the transaction price and will estimate fair
value utilizing an internal pricing model. This process involves quantitative and qualitative analysis and is overseen by investment and
accounting professionals. Examples of procedures performed include, but are not limited to, initial and on-going review of third-party
pricing services methodologies, review of pricing statistics and trends, back testing recent trades, and monitoring of trading volumes,
new issuance activity and other market activities. In addition, the Company ensures that prices received from independent brokers
represent a reasonable estimate of fair value through the use of internal and external cash flow models developed based on spreads, and
when available, market indices. As a result of this analysis, if the Company determines that there is a more appropriate fair value based
upon the available market data, the price received from the third party is adjusted accordingly. The Company's internal pricing model
utilizes the Company's best estimate of expected future cash flows discounted at a rate of return that a market participant would require.
The significant inputs to the model include, but are not limited to, current market inputs, such as credit loss assumptions, estimated
prepayment speeds and market risk premiums.
The Company has analyzed the third-party pricing services’ valuation methodologies and related inputs, and has also evaluated the
various types of securities in its investment portfolio to determine an appropriate fair value hierarchy level based upon trading activity
and the observability of market inputs. Most prices provided by third-party pricing services are classified into Level 2 because the
inputs used in pricing the securities are market observable. Due to a general lack of transparency in the process that brokers use to
develop prices, most valuations that are based on brokers’ prices are classified as Level 3. Some valuations may be classified as Level 2
if the price can be corroborated. Internal matrix priced securities, primarily consisting of certain private placement securities, are also
classified as Level 3 due to significant non-observable inputs.