The Hartford 2009 Annual Report Download - page 180
Download and view the complete annual report
Please find page 180 of the 2009 The Hartford annual report below. You can navigate through the pages in the report by either clicking on the pages listed below, or by using the keyword search tool below to find specific information within the annual report.-
 1
1 -
2
-
3
-
4
-
5
-
6
-
7
-
8
-
9
-
10
-
11
-
12
-
13
-
14
-
15
-
16
-
17
-
18
-
19
-
20
-
21
-
22
-
23
-
24
-
25
-
26
-
27
-
28
-
29
-
30
-
31
-
32
-
33
-
34
-
35
-
36
-
37
-
38
-
39
-
40
-
41
-
42
-
43
-
44
-
45
-
46
-
47
-
48
-
49
-
50
-
51
-
52
-
53
-
54
-
55
-
56
-
57
-
58
-
59
-
60
-
61
-
62
-
63
-
64
-
65
-
66
-
67
-
68
-
69
-
70
-
71
-
72
-
73
-
74
-
75
-
76
-
77
-
78
-
79
-
80
-
81
-
82
-
83
-
84
-
85
-
86
-
87
-
88
-
89
-
90
-
91
-
92
-
93
-
94
-
95
-
96
-
97
-
98
-
99
-
100
-
101
-
102
-
103
-
104
-
105
-
106
-
107
-
108
-
109
-
110
-
111
-
112
-
113
-
114
-
115
-
116
-
117
-
118
-
119
-
120
-
121
-
122
-
123
-
124
-
125
-
126
-
127
-
128
-
129
-
130
-
131
-
132
-
133
-
134
-
135
-
136
-
137
-
138
-
139
-
140
-
141
-
142
-
143
-
144
-
145
-
146
-
147
-
148
-
149
-
150
-
151
-
152
-
153
-
154
-
155
-
156
-
157
-
158
-
159
-
160
-
161
-
162
-
163
-
164
-
165
-
166
-
167
-
168
-
169
-
 170
170 -
 171
171 -
 172
172 -
 173
173 -
 174
174 -
 175
175 -
 176
176 -
 177
177 -
 178
178 -
 179
179 -
 180
180 -
 181
181 -
 182
182 -
 183
183 -
 184
184 -
 185
185 -
 186
186 -
 187
187 -
 188
188 -
 189
189 -
 190
190 -
191
-
192
-
193
-
194
-
195
-
196
-
197
-
198
-
199
-
200
-
201
-
202
-
203
-
204
-
205
-
206
-
207
-
208
-
209
-
210
-
211
-
212
-
213
-
214
-
215
-
216
-
217
-
218
-
219
-
220
-
221
-
222
-
223
-
224
-
225
-
226
-
227
-
228
-
229
-
230
-
231
-
232
-
233
-
234
-
235
-
236
-
237
-
238
-
239
-
240
-
241
-
242
-
243
-
244
-
245
-
246
-
247
-
248
-
249
-
250
-
251
-
252
-
253
-
254
-
255
-
256
-
257
-
258
-
259
-
260
-
261
-
262
-
263
-
264
-
265
-
266
-
267
 |
 |
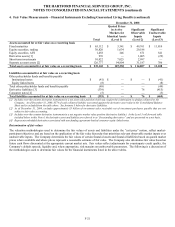
THE HARTFORD FINANCIAL SERVICES GROUP, INC.
NOTES TO CONSOLIDATED FINANCIAL STATEMENTS (continued)
F-31
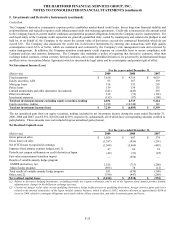
5. Investments and Derivative Instruments
Significant Investment Accounting Policies
Overview
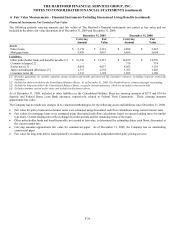
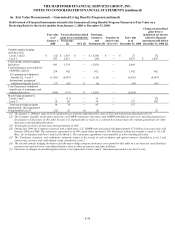
The Company’ s investments in fixed maturities include bonds, redeemable preferred stock and commercial paper. These investments,
along with certain equity securities, which include common and non-redeemable preferred stocks, are classified as AFS and are carried
at fair value. The after-tax difference from cost or amortized cost is reflected in stockholders’ equity as a component of Other
Comprehensive Income (Loss) (“OCI”), after adjustments for the effect of deducting the life and pension policyholders’ share of the
immediate participation guaranteed contracts and certain life and annuity deferred policy acquisition costs and reserve adjustments. The
equity investments associated with the variable annuity products offered in Japan are recorded at fair value and are classified as trading
with changes in fair value recorded in net investment income. Policy loans are carried at outstanding balance. Mortgage loans are
recorded at the outstanding principal balance adjusted for amortization of premiums or discounts and net of valuation allowances.
Short-term investments are carried at amortized cost, which approximates fair value. Limited partnerships and other alternative
investments are reported at their carrying value with the change in carrying value accounted for under the equity method and
accordingly the Company’ s share of earnings are included in net investment income. Recognition of limited partnerships and other
alternative investment income is delayed due to the availability of the related financial information, as private equity and other funds are
generally on a three-month delay and hedge funds are on a one-month delay. Accordingly, income for the years ended December 31,
2009, 2008 and 2007 may not include the full impact of current year changes in valuation of the underlying assets and liabilities, which
are generally obtained from the limited partnerships and other alternative investments’ general partners. Other investments primarily
consist of derivatives instruments which are carried at fair value.
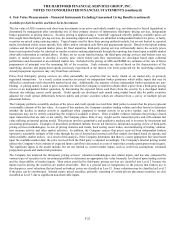
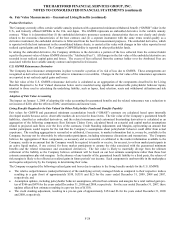
Recognition and Presentation of Other-Than-Temporary Impairments
In April 2009, the FASB updated the guidance related to the recognition and presentation of other-than-temporary impairments which
modifies the recognition of other-than-temporary impairment (“impairment”) losses for debt securities. This new guidance is also
applied to certain equity securities with debt-like characteristics (collectively “debt securities”). Under the new guidance, a debt
security is deemed to be other-than-temporarily impaired if it meets the following conditions: 1) the Company intends to sell or it is
more likely than not the Company will be required to sell the security before a recovery in value, or 2) the Company does not expect to
recover the entire amortized cost basis of the security. If the Company intends to sell or it is more likely than not the Company will be
required to sell the security before a recovery in value, a charge is recorded in net realized capital losses equal to the difference between
the fair value and amortized cost basis of the security. For those other-than-temporarily impaired debt securities which do not meet the
first condition and for which the Company does not expect to recover the entire amortized cost basis, the difference between the
security’ s amortized cost basis and the fair value is separated into the portion representing a credit impairment, which is recorded in net
realized capital losses, and the remaining impairment, which is recorded in OCI. Generally, the Company determines a security's credit
impairment as the difference between its amortized cost basis and its best estimate of expected future cash flows discounted at the
security’ s effective yield prior to impairment. The remaining non-credit impairment, which is recorded in OCI, is the difference
between the security’ s fair value and the Company’ s best estimate of expected future cash flows discounted at the security’ s effective
yield prior to the impairment. The remaining non-credit impairment typically represents current market liquidity and risk premiums.
The previous amortized cost basis less the impairment recognized in net realized capital losses becomes the security’ s new cost basis.
The Company accretes the new cost basis to the estimated future cash flows over the expected remaining life of the security by
prospectively adjusting the security’ s yield, if necessary. Prior to the adoption of this accounting guidance, the Company recorded the
entire difference between the fair value and cost or amortized cost basis of the security in net realized capital losses unless the Company
could assert the intent and ability to hold the security for a period sufficient to allow for recovery of fair value to its amortized cost basis.
The Company evaluates whether a credit impairment exists for debt securities by considering primarily the following factors: (a) the
length of time and extent to which the fair value has been less than the amortized cost of the security, (b) changes in the financial
condition, credit rating and near-term prospects of the issuer, (c) whether the issuer is current on contractually obligated interest and
principal payments, (d) changes in the financial condition of the security’ s underlying collateral and (e) the payment structure of the
security. The Company’ s best estimate of expected future cash flows used to determine the credit loss amount is a quantitative and
qualitative process that incorporates information received from third-party sources along with certain internal assumptions and
judgments regarding the future performance of the security. The Company’ s best estimate of future cash flows involves assumptions
including, but not limited to, various performance indicators, such as historical and projected default and recovery rates, credit ratings,
current delinquency rates, loan-to-value ratios and the possibility of obligor re-financing. In addition, for securitized debt securities, the
Company considers factors including, but not limited to, commercial and residential property value declines that vary by property type
and location and average cumulative collateral loss rates that vary by vintage year. These assumptions require the use of significant
management judgment and include the probability of issuer default and estimates regarding timing and amount of expected recoveries
which may include estimating the underlying collateral value. In addition, projections of expected future debt security cash flows may
change based upon new information regarding the performance of the issuer and/or underlying collateral such as changes in the
projections of the underlying property value estimates.