The Hartford 2009 Annual Report Download - page 45
Download and view the complete annual report
Please find page 45 of the 2009 The Hartford annual report below. You can navigate through the pages in the report by either clicking on the pages listed below, or by using the keyword search tool below to find specific information within the annual report.-
 1
1 -
2
-
3
-
4
-
5
-
6
-
7
-
8
-
9
-
10
-
11
-
12
-
13
-
14
-
15
-
16
-
17
-
18
-
19
-
20
-
21
-
22
-
23
-
24
-
25
-
26
-
27
-
28
-
29
-
30
-
31
-
32
-
33
-
34
-
 35
35 -
 36
36 -
 37
37 -
 38
38 -
 39
39 -
 40
40 -
 41
41 -
 42
42 -
 43
43 -
 44
44 -
 45
45 -
 46
46 -
 47
47 -
 48
48 -
 49
49 -
 50
50 -
 51
51 -
 52
52 -
 53
53 -
 54
54 -
 55
55 -
56
-
57
-
58
-
59
-
60
-
61
-
62
-
63
-
64
-
65
-
66
-
67
-
68
-
69
-
70
-
71
-
72
-
73
-
74
-
75
-
76
-
77
-
78
-
79
-
80
-
81
-
82
-
83
-
84
-
85
-
86
-
87
-
88
-
89
-
90
-
91
-
92
-
93
-
94
-
95
-
96
-
97
-
98
-
99
-
100
-
101
-
102
-
103
-
104
-
105
-
106
-
107
-
108
-
109
-
110
-
111
-
112
-
113
-
114
-
115
-
116
-
117
-
118
-
119
-
120
-
121
-
122
-
123
-
124
-
125
-
126
-
127
-
128
-
129
-
130
-
131
-
132
-
133
-
134
-
135
-
136
-
137
-
138
-
139
-
140
-
141
-
142
-
143
-
144
-
145
-
146
-
147
-
148
-
149
-
150
-
151
-
152
-
153
-
154
-
155
-
156
-
157
-
158
-
159
-
160
-
161
-
162
-
163
-
164
-
165
-
166
-
167
-
168
-
169
-
170
-
171
-
172
-
173
-
174
-
175
-
176
-
177
-
178
-
179
-
180
-
181
-
182
-
183
-
184
-
185
-
186
-
187
-
188
-
189
-
190
-
191
-
192
-
193
-
194
-
195
-
196
-
197
-
198
-
199
-
200
-
201
-
202
-
203
-
204
-
205
-
206
-
207
-
208
-
209
-
210
-
211
-
212
-
213
-
214
-
215
-
216
-
217
-
218
-
219
-
220
-
221
-
222
-
223
-
224
-
225
-
226
-
227
-
228
-
229
-
230
-
231
-
232
-
233
-
234
-
235
-
236
-
237
-
238
-
239
-
240
-
241
-
242
-
243
-
244
-
245
-
246
-
247
-
248
-
249
-
250
-
251
-
252
-
253
-
254
-
255
-
256
-
257
-
258
-
259
-
260
-
261
-
262
-
263
-
264
-
265
-
266
-
267
 |
 |

45
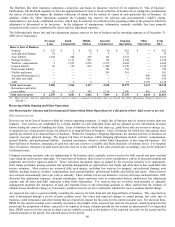
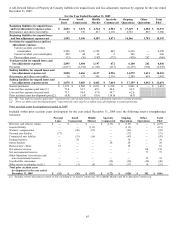
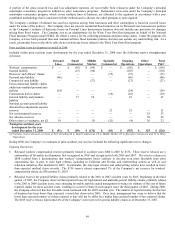
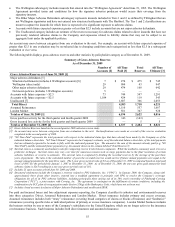
A roll-forward follows of Property & Casualty liabilities for unpaid losses and loss adjustment expenses by segment for the year ended
December 31, 2009:
For the Year Ended December 31, 2009
Personal
Lines
Small
Commercial
Middle
Market
Specialty
Commercial
Ongoing
Operations
Other
Operations
Total
P&C
Beginning liabilities for unpaid losses
and loss adjustment expenses-gross
$
2,052 $
3,572
$
4,744
$
6,981
$
17,349
$
4,584
$
21,933
Reinsurance and other recoverables 60 176 437 2,110 2,783 803 3,586
Beginning liabilities for unpaid losses
and loss adjustment expenses-net
1,992
3,396
4,307
4,871
14,566
3,781
18,347
Provision for unpaid losses and loss
adjustment expenses
Current accident year before
catastrophes
2,700
1,396
1,352
842
6,290
—
6,290
Current accident year catastrophes 228 44 32 2 306 — 306
Prior accident years (33) (36) (187) (172) (428) 242 (186)
Total provision for unpaid losses and
loss adjustment expenses
2,895
1,404
1,197
672
6,168
242
6,410
Payments (2,837) (1,334) (1,367) (617) (6,155) (392) (6,547)
Ending liabilities for unpaid losses and
loss adjustment expenses-net
2,050
3,466
4,137
4,926
14,579
3,631
18,210
Reinsurance and other recoverables 20 137 305 2,118 2,580 861 3,441
Ending liabilities for unpaid losses and
loss adjustment expenses-gross
$
2,070
$
3,603
$
4,442
$
7,044 $
17,159
$
4,492
$
21,651
Earned premiums $ 3,952 $ 2,580 $2,101 $1,228 $ 9,861 $ — $ 9,861
Loss and loss expense paid ratio [1] 71.8 51.7 65.1 50.4 62.5
Loss and loss expense incurred ratio 73.3 54.4 57.0 54.7 62.6
Prior accident years development (pts) [2] (0.8) (1.4) (8.9) (14.0) (4.3)
[1] The “loss and loss expense paid ratio” represents the ratio of paid losses and loss adjustment expenses to earned premiums.
[2] “Prior accident years development (pts)” represents the ratio of prior accident years development to earned premiums.
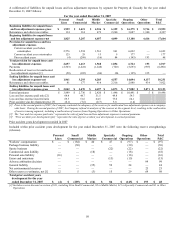
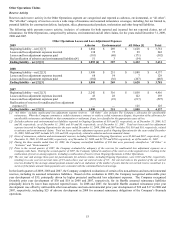
Prior accident years development recorded in 2009
Included within prior accident years development for the year ended December 31, 2009 were the following reserve strengthenings
(releases):
Personal
Lines
Small
Commercial
Middle
Market
Specialty
Commercial
Ongoing
Operations
Other
Operations
Total
P&C
Directors’ and officers’ claims $ — $ — $— $ (127) $ (127) $ — $ (127)
General liability — — (112) — (112) — (112)
Workers’ compensation — (40) (52) — (92) — (92)
Personal auto liability (77) — — — (77) — (77)
Commercial auto liability — (33) (14) — (47) — (47)
Package business — 38
— — 38 — 38
Surety business — — — 28 28 — 28
Homeowners’ claims 18 — — — 18 — 18
Net asbestos reserves — — — — — 138 138
Net environmental reserves — — — — — 75 75
Other Operations’ non-asbestos and
non-environmental reserves
— — — — — 35 35
Uncollectible reinsurance — — — (20) (20) (20) (40)
Other reserve re-estimates, net [1] 26 (1) (9) (53) (37) 14 (23)
Total prior accident years
development for the year ended
December 31, 2009
$
(33)
$
(36)
$
(187)
$
(172)
$
(428)
$
242
$
(186)
[1] Includes reserve discount accretion of $24, including $7 in Small Commercial, $9 in Middle Market and $8 in Specialty Commercial.