The Hartford 2009 Annual Report Download - page 239
Download and view the complete annual report
Please find page 239 of the 2009 The Hartford annual report below. You can navigate through the pages in the report by either clicking on the pages listed below, or by using the keyword search tool below to find specific information within the annual report.-
 1
1 -
2
-
3
-
4
-
5
-
6
-
7
-
8
-
9
-
10
-
11
-
12
-
13
-
14
-
15
-
16
-
17
-
18
-
19
-
20
-
21
-
22
-
23
-
24
-
25
-
26
-
27
-
28
-
29
-
30
-
31
-
32
-
33
-
34
-
35
-
36
-
37
-
38
-
39
-
40
-
41
-
42
-
43
-
44
-
45
-
46
-
47
-
48
-
49
-
50
-
51
-
52
-
53
-
54
-
55
-
56
-
57
-
58
-
59
-
60
-
61
-
62
-
63
-
64
-
65
-
66
-
67
-
68
-
69
-
70
-
71
-
72
-
73
-
74
-
75
-
76
-
77
-
78
-
79
-
80
-
81
-
82
-
83
-
84
-
85
-
86
-
87
-
88
-
89
-
90
-
91
-
92
-
93
-
94
-
95
-
96
-
97
-
98
-
99
-
100
-
101
-
102
-
103
-
104
-
105
-
106
-
107
-
108
-
109
-
110
-
111
-
112
-
113
-
114
-
115
-
116
-
117
-
118
-
119
-
120
-
121
-
122
-
123
-
124
-
125
-
126
-
127
-
128
-
129
-
130
-
131
-
132
-
133
-
134
-
135
-
136
-
137
-
138
-
139
-
140
-
141
-
142
-
143
-
144
-
145
-
146
-
147
-
148
-
149
-
150
-
151
-
152
-
153
-
154
-
155
-
156
-
157
-
158
-
159
-
160
-
161
-
162
-
163
-
164
-
165
-
166
-
167
-
168
-
169
-
170
-
171
-
172
-
173
-
174
-
175
-
176
-
177
-
178
-
179
-
180
-
181
-
182
-
183
-
184
-
185
-
186
-
187
-
188
-
189
-
190
-
191
-
192
-
193
-
194
-
195
-
196
-
197
-
198
-
199
-
200
-
201
-
202
-
203
-
204
-
205
-
206
-
207
-
208
-
209
-
210
-
211
-
212
-
213
-
214
-
215
-
216
-
217
-
218
-
219
-
220
-
221
-
222
-
223
-
224
-
225
-
226
-
227
-
228
-
 229
229 -
 230
230 -
 231
231 -
 232
232 -
 233
233 -
 234
234 -
 235
235 -
 236
236 -
 237
237 -
 238
238 -
 239
239 -
 240
240 -
 241
241 -
 242
242 -
 243
243 -
 244
244 -
 245
245 -
 246
246 -
 247
247 -
 248
248 -
 249
249 -
250
-
251
-
252
-
253
-
254
-
255
-
256
-
257
-
258
-
259
-
260
-
261
-
262
-
263
-
264
-
265
-
266
-
267
 |
 |

THE HARTFORD FINANCIAL SERVICES GROUP, INC.
NOTES TO CONSOLIDATED FINANCIAL STATEMENTS (continued)
F-90
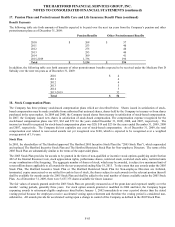
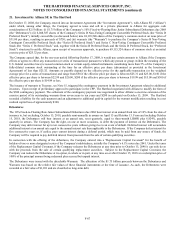
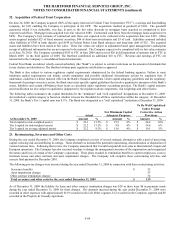
24. Sale of Joint Venture Interest in ICATU Hartford Seguros, S.A.
On November 23, 2009, in keeping with the Company's June 2009 announcement to return to its historical strengths as a U.S.-centric
insurance company, the Company entered into a Share Purchase Agreement to sell its joint venture interest in ICATU Hartford Seguros,
S.A. ("IHS"), its Brazilian insurance operation, to its partner, ICATU Holding S.A., for $135. The transaction is expected to close in the
first quarter of 2010. IHS primarily sells life insurance policies, capitalization products and private pension plans. The investment in
IHS was reported as an equity method investment in Other Assets. As a result of the Share Purchase Agreement, the Company recorded
in 2009, an asset impairment charge, net of unrealized capital gains and foreign currency translation adjustments, in net realized capital
losses of approximately $51, pre-tax, or $44, after-tax.
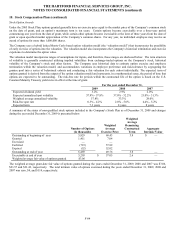
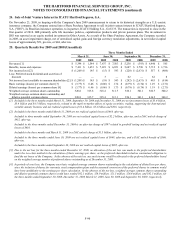
25. Quarterly Results For 2009 and 2008 (Unaudited)
Three Months Ended
March 31, June 30, September 30, December 31,
2009 2008 2009 2008 2009 2008 2009 2008
Revenues [1] $5,394 $1,544 $7,637 $7,503 $5,230 $ (393) $6,440 $ 565
Benefits, losses and expenses $7,411 $1,453 $7,619 $6,851 $5,687 $ 3,790 $5,712 $1,716
Net income (loss) [2] $(1,209) $ 145 $ (15) $ 543 $ (220) $ (2,631) $ 557 $ (806)
Less: Preferred stock dividends and accretion of
discount — — 3 — 62 — 62 8
Net income (loss) available to common shareholders [2] $(1,209) $ 145 $ (18) $ 543 $ (282) $ (2,631) $ 495 $ (814)
Basic earnings (losses) per common share [3] $(3.77) $0.46 $(0.06) $1.74 $(0.79) $ (8.74) $1.29 $(2.71)
Diluted earnings (losses) per common share [4] $(3.77) $0.46 $(0.06) $1.73 $(0.79) $ (8.74) $1.19 $(2.71)
Weighted average common shares outstanding 320.8 313.8 325.4 311.7 356.1 301.1 382.7 300.2
Weighted average common shares outstanding and
dilutive potential common shares 320.8 315.7 325.4 313.1 356.1 301.1 416.2 300.2
[1] Included in the three months ended March 31, 2008, September 30, 2008 and December 31, 2008 are net investment losses of $3.6 billion,
$3.4 billion and $4.5 billion, respectively, related to the mark-to-market effects of equity securities, trading, supporting the International
variable annuity business and net realized capital losses of $1.4 billion, $3.4 billion and $816, respectively.
[2] Included in the three months ended March 31, 2008 are net realized capital losses of $648, after-tax.
Included in three months ended September 30, 2008 are net realized capital losses of $2.2 billion, after-tax, and a DAC unlock charge of
$932, after-tax.
Included in the three months ended December 31, 2008 is an after-tax charge of $597 related to goodwill testing and net realized capital
losses of $610.
Included in the three months end March 31, 2009 is a DAC unlock charge of $1.5 billion, after-tax.
Included in the three months ended June 30, 2009 are net realized capital losses of $649, after-tax, and a DAC unlock benefit of $360,
after-tax.
Included in the three months ended September 30, 2009 are net realized capital losses of $885, after-tax.
[3] Due to the net loss for the three months ended December 31, 2008, no allocation of the net loss was made to the preferred shareholders
under the two-class method in the calculation of basic earnings per share, as the preferred shareholders had no contractual obligation to
fund the net losses of the Company. In the absence of the net loss, any such income would be allocated to the preferred shareholders based
on the weighted average number of preferred shares outstanding as of December 31, 2008.
[4] In periods of a net loss, the Company uses basic weighted average common shares outstanding in the calculation of diluted loss per share,
since the inclusion of shares for warrants, stock compensation plans and the assumed conversion of the preferred shares to common would
have been antidilutive to the earnings per share calculation. In the absence of the net loss, weighted average common shares outstanding
and dilutive potential common shares would have totaled 302.1 million, 320.9 million, 321.5 million, 326.6 million, and 382.5 million, for
the three months ended September 30, 2008, December 31, 2008, March 31, 2009, June 30, 2009 and September 30, 2009, respectively.