The Hartford 2009 Annual Report Download - page 136
Download and view the complete annual report
Please find page 136 of the 2009 The Hartford annual report below. You can navigate through the pages in the report by either clicking on the pages listed below, or by using the keyword search tool below to find specific information within the annual report.-
 1
1 -
2
-
3
-
4
-
5
-
6
-
7
-
8
-
9
-
10
-
11
-
12
-
13
-
14
-
15
-
16
-
17
-
18
-
19
-
20
-
21
-
22
-
23
-
24
-
25
-
26
-
27
-
28
-
29
-
30
-
31
-
32
-
33
-
34
-
35
-
36
-
37
-
38
-
39
-
40
-
41
-
42
-
43
-
44
-
45
-
46
-
47
-
48
-
49
-
50
-
51
-
52
-
53
-
54
-
55
-
56
-
57
-
58
-
59
-
60
-
61
-
62
-
63
-
64
-
65
-
66
-
67
-
68
-
69
-
70
-
71
-
72
-
73
-
74
-
75
-
76
-
77
-
78
-
79
-
80
-
81
-
82
-
83
-
84
-
85
-
86
-
87
-
88
-
89
-
90
-
91
-
92
-
93
-
94
-
95
-
96
-
97
-
98
-
99
-
100
-
101
-
102
-
103
-
104
-
105
-
106
-
107
-
108
-
109
-
110
-
111
-
112
-
113
-
114
-
115
-
116
-
117
-
118
-
119
-
120
-
121
-
122
-
123
-
124
-
125
-
 126
126 -
 127
127 -
 128
128 -
 129
129 -
 130
130 -
 131
131 -
 132
132 -
 133
133 -
 134
134 -
 135
135 -
 136
136 -
 137
137 -
 138
138 -
 139
139 -
 140
140 -
 141
141 -
 142
142 -
 143
143 -
 144
144 -
 145
145 -
 146
146 -
147
-
148
-
149
-
150
-
151
-
152
-
153
-
154
-
155
-
156
-
157
-
158
-
159
-
160
-
161
-
162
-
163
-
164
-
165
-
166
-
167
-
168
-
169
-
170
-
171
-
172
-
173
-
174
-
175
-
176
-
177
-
178
-
179
-
180
-
181
-
182
-
183
-
184
-
185
-
186
-
187
-
188
-
189
-
190
-
191
-
192
-
193
-
194
-
195
-
196
-
197
-
198
-
199
-
200
-
201
-
202
-
203
-
204
-
205
-
206
-
207
-
208
-
209
-
210
-
211
-
212
-
213
-
214
-
215
-
216
-
217
-
218
-
219
-
220
-
221
-
222
-
223
-
224
-
225
-
226
-
227
-
228
-
229
-
230
-
231
-
232
-
233
-
234
-
235
-
236
-
237
-
238
-
239
-
240
-
241
-
242
-
243
-
244
-
245
-
246
-
247
-
248
-
249
-
250
-
251
-
252
-
253
-
254
-
255
-
256
-
257
-
258
-
259
-
260
-
261
-
262
-
263
-
264
-
265
-
266
-
267
 |
 |

136
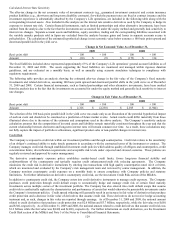
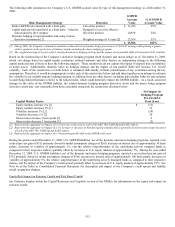
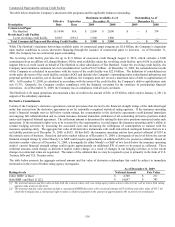
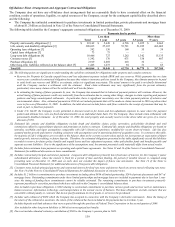
Commercial Paper and Revolving Credit Facility
The table below details the Company’ s short-term debt programs and the applicable balances outstanding.
Maximum Available As of Outstanding As of
Effective Expiration December 31,
December 31,
Description Date Date 2009 2008
2009 2008
Commercial Paper
The Hartford 11/10/86 N/A $ 2,000 $ 2,000 $ — $ 374
Revolving Credit Facility
5-year revolving credit facility 8/9/07 8/9/12 1,900 1,900 — —
Total Commercial Paper and Revolving Credit Facility $ 3,900 $ 3,900 $ — $ 374
While The Hartford’ s maximum borrowings available under its commercial paper program are $2.0 billion, the Company is dependent
upon market conditions to access short-term financing through the issuance of commercial paper to investors. As of December 31,
2009, the Company has no commercial paper outstanding.
The revolving credit facility provides for up to $1.9 billion of unsecured credit through August 9, 2012, which excludes a $100
commitment from an affiliate of Lehman Brothers. Of the total availability under the revolving credit facility, up to $100 is available to
support letters of credit issued on behalf of The Hartford or other subsidiaries of The Hartford. Under the revolving credit facility, the
Company must maintain a minimum level of consolidated net worth of $12.5 billion. At December 31, 2009, the consolidated net worth
of the Company as calculated in accordance with the terms of the credit facility was $22.9 billion. The definition of consolidated net
worth under the terms of the credit facility, excludes AOCI and includes the Company’ s outstanding junior subordinated debentures and
perpetual preferred securities, net of discount. In addition, the Company must not exceed a maximum ratio of debt to capitalization of
40%. At December 31, 2009, as calculated in accordance with the terms of the credit facility, the Company’ s debt to capitalization ratio
was 15.3%. Quarterly, the Company certifies compliance with the financial covenants for the syndicate of participating financial
institutions. As of December 31, 2009, the Company was in compliance with all such covenants.
The Hartford’ s Life Japan operations also maintain a line of credit in the amount of $54, or ¥5 billion, which expires January 4, 2011 in
support of the subsidiary operations.
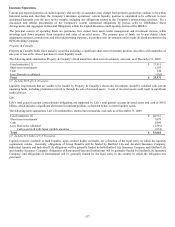
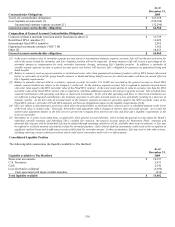
Derivative Commitments
Certain of the Company’ s derivative agreements contain provisions that are tied to the financial strength ratings of the individual legal
entity that entered into the derivative agreement as set by nationally recognized statistical rating agencies. If the insurance operating
entity’ s financial strength were to fall below certain ratings, the counterparties to the derivative agreements could demand immediate
and ongoing full collateralization and in certain instances demand immediate settlement of all outstanding derivative positions traded
under each impacted bilateral agreement. The settlement amount is determined by netting the derivative positions transacted under each
agreement. If the termination rights were to be exercised by the counterparties, it could impact the insurance operating entity’ s ability to
conduct hedging activities by increasing the associated costs and decreasing the willingness of counterparties to transact with the
insurance operating entity. The aggregate fair value of all derivative instruments with credit-risk-related contingent features that are in a
net liability position as of December 31, 2009, is $655. Of this $655, the insurance operating entities have posted collateral of $591 in
the normal course of business. Based on derivative market values as of December 31, 2009, a downgrade of one level below the current
financial strength ratings by either Moody’ s or S&P could require approximately an additional $50 to be posted as collateral. Based on
derivative market values as of December 31, 2009, a downgrade by either Moody’ s or S&P of two levels below the insurance operating
entities’ current financial strength ratings could require approximately an additional $70 of assets to be posted as collateral. These
collateral amounts could change as derivative market values change, as a result of changes in our hedging activities or to the extent
changes in contractual terms are negotiated. The nature of the collateral that we may be required to post is primarily in the form of U.S.
Treasury bills and U.S. Treasury notes.
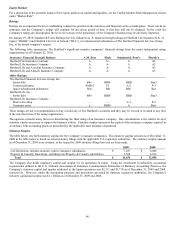
The table below presents the aggregate notional amount and fair value of derivative relationships that could be subject to immediate
termination in the event of further rating agency downgrades.
As of December 31, 2009
Ratings levels Notional Amount Fair Value
Either BBB+ or Baa1 $ 4,700 $ 211
Both BBB+ and Baa1 [1] [2] $ 14,057 $ 381
[1] The notional amount and fair value include both the scenario where only one rating agency takes action to this level as well as where both rating
agencies take action to this level.
[2] The notional and fair value amounts include a customized GMWB derivative with a notional amount of $5.4 billion and a fair value of $137, for
which the Company has a contractual right to make a collateral payment in the amount of approximately $61 to prevent its termination.