The Hartford 2009 Annual Report Download - page 128
Download and view the complete annual report
Please find page 128 of the 2009 The Hartford annual report below. You can navigate through the pages in the report by either clicking on the pages listed below, or by using the keyword search tool below to find specific information within the annual report.-
 1
1 -
2
-
3
-
4
-
5
-
6
-
7
-
8
-
9
-
10
-
11
-
12
-
13
-
14
-
15
-
16
-
17
-
18
-
19
-
20
-
21
-
22
-
23
-
24
-
25
-
26
-
27
-
28
-
29
-
30
-
31
-
32
-
33
-
34
-
35
-
36
-
37
-
38
-
39
-
40
-
41
-
42
-
43
-
44
-
45
-
46
-
47
-
48
-
49
-
50
-
51
-
52
-
53
-
54
-
55
-
56
-
57
-
58
-
59
-
60
-
61
-
62
-
63
-
64
-
65
-
66
-
67
-
68
-
69
-
70
-
71
-
72
-
73
-
74
-
75
-
76
-
77
-
78
-
79
-
80
-
81
-
82
-
83
-
84
-
85
-
86
-
87
-
88
-
89
-
90
-
91
-
92
-
93
-
94
-
95
-
96
-
97
-
98
-
99
-
100
-
101
-
102
-
103
-
104
-
105
-
106
-
107
-
108
-
109
-
110
-
111
-
112
-
113
-
114
-
115
-
116
-
117
-
 118
118 -
 119
119 -
 120
120 -
 121
121 -
 122
122 -
 123
123 -
 124
124 -
 125
125 -
 126
126 -
 127
127 -
 128
128 -
 129
129 -
 130
130 -
 131
131 -
 132
132 -
 133
133 -
 134
134 -
 135
135 -
 136
136 -
 137
137 -
 138
138 -
139
-
140
-
141
-
142
-
143
-
144
-
145
-
146
-
147
-
148
-
149
-
150
-
151
-
152
-
153
-
154
-
155
-
156
-
157
-
158
-
159
-
160
-
161
-
162
-
163
-
164
-
165
-
166
-
167
-
168
-
169
-
170
-
171
-
172
-
173
-
174
-
175
-
176
-
177
-
178
-
179
-
180
-
181
-
182
-
183
-
184
-
185
-
186
-
187
-
188
-
189
-
190
-
191
-
192
-
193
-
194
-
195
-
196
-
197
-
198
-
199
-
200
-
201
-
202
-
203
-
204
-
205
-
206
-
207
-
208
-
209
-
210
-
211
-
212
-
213
-
214
-
215
-
216
-
217
-
218
-
219
-
220
-
221
-
222
-
223
-
224
-
225
-
226
-
227
-
228
-
229
-
230
-
231
-
232
-
233
-
234
-
235
-
236
-
237
-
238
-
239
-
240
-
241
-
242
-
243
-
244
-
245
-
246
-
247
-
248
-
249
-
250
-
251
-
252
-
253
-
254
-
255
-
256
-
257
-
258
-
259
-
260
-
261
-
262
-
263
-
264
-
265
-
266
-
267
 |
 |
128
As interest rates decline, certain mortgage-backed securities are more susceptible to paydowns and prepayments. During such periods,
the Company generally will not be able to reinvest the proceeds at comparable yields. Lower interest rates will also likely result in
lower net investment income, increased hedging cost associated with variable annuities and, if declines are sustained for a long period of
time, it may subject the Company to reinvestment risks, higher pension costs expense and possibly reduced profit margins associated
with guaranteed crediting rates on certain Life products. Conversely, the fair value of the investment portfolio will increase when
interest rates decline and the Company’ s interest expense will be lower on its variable rate debt obligations.
The Company believes that an increase in interest rates from the current levels is generally a favorable development for the Company.
Rate increases are expected to provide additional net investment income, increase sales of fixed rate Life investment products, reduce
the cost of the variable annuity hedging program, limit the potential risk of margin erosion due to minimum guaranteed crediting rates in
certain Life products and, if sustained, could reduce the Company’ s prospective pension expense. Conversely, a rise in interest rates
will reduce the fair value of the investment portfolio, increase interest expense on the Company’ s variable rate debt obligations and, if
long-term interest rates rise dramatically within a six to twelve month time period, certain Life businesses may be exposed to
disintermediation risk. Disintermediation risk refers to the risk that policyholders will surrender their contracts in a rising interest rate
environment requiring the Company to liquidate assets in an unrealized loss position. In conjunction with the interest rate risk
measurement and management techniques, certain of Life’ s fixed income product offerings have market value adjustment provisions at
contract surrender. An increase in interest rates may also impact the Company’ s tax planning strategies and in particular its ability to
utilize tax benefits to offset certain previously recognized realized capital losses.
The investments and liabilities primarily associated with interest rate risk are included in the following discussion. Certain product
liabilities, including those containing GMWB, GMIB, GMAB, or GMDB, expose the Company to interest rate risk but also have
significant equity risk. These liabilities are discussed as part of the Equity Risk section below.
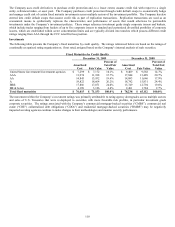
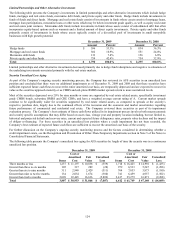
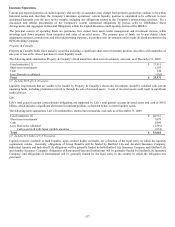
Fixed Maturity Investments
The Company’ s investment portfolios primarily consist of investment grade fixed maturity securities. The fair value of these
investments was $71.2 billion and $65.1 billion at December 31, 2009 and 2008, respectively. The fair value of these and other invested
assets fluctuates depending on the interest rate environment and other general economic conditions. The weighted average duration of
the fixed maturity portfolio was approximately 4.9 and 4.8 years as of December 31, 2009 and 2008, respectively.
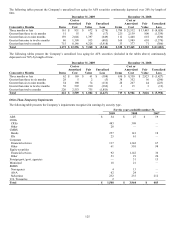
Liabilities
The Company’ s investment contracts and certain insurance product liabilities, other than non-guaranteed separate accounts, include
asset accumulation vehicles such as fixed annuities, guaranteed investment contracts, other investment and universal life-type contracts
and certain insurance products such as long-term disability.
Asset accumulation vehicles primarily require a fixed rate payment, often for a specified period of time. Product examples include fixed
rate annuities with a market value adjustment feature and fixed rate guaranteed investment contracts. The term to maturity of these
contracts generally range from less than one year to ten years. In addition, certain products such as universal life contracts and the
general account portion of Life’ s variable annuity products, credit interest to policyholders subject to market conditions and minimum
interest rate guarantees. The term to maturity of these products is short to intermediate.
While interest rate risk associated with many of these products has been reduced through the use of market value adjustment features
and surrender charges, the primary risk associated with these products is that the spread between investment return and credited rate
may not be sufficient to earn targeted returns.
The Company also manages the risk of certain insurance liabilities similarly to investment type products due to the relative
predictability of the aggregate cash flow payment streams. Products in this category may contain significant actuarial (including
mortality and morbidity) pricing and cash flow risks. Product examples include structured settlement contracts, on-benefit annuities
(i.e., the annuitant is currently receiving benefits thereon) and short-term and long-term disability contracts. The cash outflows
associated with these policy liabilities are not interest rate sensitive but do vary based on the timing and amount of benefit payments.
The primary risks associated with these products are that the benefits will exceed expected actuarial pricing and/or that the actual timing
of the cash flows will differ from those anticipated, resulting in an investment return lower than that assumed in pricing. Average
contract duration can range from less than one year to typically up to fifteen years.
Derivatives
The Company utilizes a variety of derivative instruments to mitigate interest rate risk. Interest rate swaps are primarily used to convert
interest receipts or payments to a fixed or variable rate. The use of such swaps enables the Company to customize contract terms and
conditions to customer objectives and satisfies its asset/liability duration matching policy. Interest rate swaps are also used to hedge the
variability in the cash flow of a forecasted purchase or sale of fixed rate securities due to changes in interest rates. Forward rate
agreements are used to convert interest receipts on floating-rate securities to fixed rates. These derivatives are used to lock in the
forward interest rate curve and reduce income volatility that results from changes in interest rates. Interest rate caps, floors, swaptions,
and futures are primarily used to manage portfolio duration.
At December 31, 2009 and 2008, notional amounts pertaining to derivatives utilized to manage interest rate risk totaled $21.3 billion
and $19.3 billion, respectively ($19.7 billion and $17.4 billion, respectively, related to investments and $1.6 billion and $1.9 billion,
respectively, related to life liabilities). The fair value of these derivatives was $18 and $457 as of December 31, 2009 and 2008,
respectively.