The Hartford 2009 Annual Report Download - page 65
Download and view the complete annual report
Please find page 65 of the 2009 The Hartford annual report below. You can navigate through the pages in the report by either clicking on the pages listed below, or by using the keyword search tool below to find specific information within the annual report.-
 1
1 -
2
-
3
-
4
-
5
-
6
-
7
-
8
-
9
-
10
-
11
-
12
-
13
-
14
-
15
-
16
-
17
-
18
-
19
-
20
-
21
-
22
-
23
-
24
-
25
-
26
-
27
-
28
-
29
-
30
-
31
-
32
-
33
-
34
-
35
-
36
-
37
-
38
-
39
-
40
-
41
-
42
-
43
-
44
-
45
-
46
-
47
-
48
-
49
-
50
-
51
-
52
-
53
-
54
-
 55
55 -
 56
56 -
 57
57 -
 58
58 -
 59
59 -
 60
60 -
 61
61 -
 62
62 -
 63
63 -
 64
64 -
 65
65 -
 66
66 -
 67
67 -
 68
68 -
 69
69 -
 70
70 -
 71
71 -
 72
72 -
 73
73 -
 74
74 -
 75
75 -
76
-
77
-
78
-
79
-
80
-
81
-
82
-
83
-
84
-
85
-
86
-
87
-
88
-
89
-
90
-
91
-
92
-
93
-
94
-
95
-
96
-
97
-
98
-
99
-
100
-
101
-
102
-
103
-
104
-
105
-
106
-
107
-
108
-
109
-
110
-
111
-
112
-
113
-
114
-
115
-
116
-
117
-
118
-
119
-
120
-
121
-
122
-
123
-
124
-
125
-
126
-
127
-
128
-
129
-
130
-
131
-
132
-
133
-
134
-
135
-
136
-
137
-
138
-
139
-
140
-
141
-
142
-
143
-
144
-
145
-
146
-
147
-
148
-
149
-
150
-
151
-
152
-
153
-
154
-
155
-
156
-
157
-
158
-
159
-
160
-
161
-
162
-
163
-
164
-
165
-
166
-
167
-
168
-
169
-
170
-
171
-
172
-
173
-
174
-
175
-
176
-
177
-
178
-
179
-
180
-
181
-
182
-
183
-
184
-
185
-
186
-
187
-
188
-
189
-
190
-
191
-
192
-
193
-
194
-
195
-
196
-
197
-
198
-
199
-
200
-
201
-
202
-
203
-
204
-
205
-
206
-
207
-
208
-
209
-
210
-
211
-
212
-
213
-
214
-
215
-
216
-
217
-
218
-
219
-
220
-
221
-
222
-
223
-
224
-
225
-
226
-
227
-
228
-
229
-
230
-
231
-
232
-
233
-
234
-
235
-
236
-
237
-
238
-
239
-
240
-
241
-
242
-
243
-
244
-
245
-
246
-
247
-
248
-
249
-
250
-
251
-
252
-
253
-
254
-
255
-
256
-
257
-
258
-
259
-
260
-
261
-
262
-
263
-
264
-
265
-
266
-
267
 |
 |
65
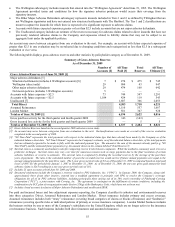
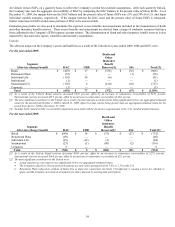
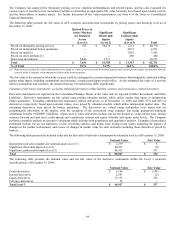
Derivative instruments classified as Level 3 include complex derivatives, primarily consisting of equity options and swaps, interest rate
derivatives which have interest rate optionality, certain credit default swaps, and long-dated interest rate swaps. These derivative
instruments are valued using pricing models which utilize both observable and unobservable inputs and, to a lesser extent, broker
quotations. A derivative instrument that is priced using both observable and unobservable inputs will be classified as a Level 3 financial
instrument in its entirety if the unobservable input is significant in developing the price. The Company utilizes derivative instruments to
manage the risk associated with certain assets and liabilities. However, the derivative instrument may not be classified with the same
fair value hierarchy level as the associated assets and liabilities.
Pension and Other Postretirement Benefit Obligations
The Company maintains a U.S. qualified defined benefit pension plan (the “Plan”) that covers substantially all employees, as well as
unfunded excess plans to provide benefits in excess of amounts permitted to be paid to participants of the Plan under the provisions of
the Internal Revenue Code. The Company has also entered into individual retirement agreements with certain retired directors providing
for unfunded supplemental pension benefits. In addition, the Company provides certain health care and life insurance benefits for
eligible retired employees. The Company maintains international plans which represent an immaterial percentage of total pension
assets, liabilities and expense and, for reporting purposes, are combined with domestic plans.
Pursuant to accounting principles related to the Company’ s pension and other postretirement obligations to employees under its various
benefit plans, the Company is required to make a significant number of assumptions in order to calculate the related liabilities and
expenses each period. The two economic assumptions that have the most impact on pension and other postretirement expense are the
discount rate and the expected long-term rate of return on plan assets. In determining the discount rate assumption, the Company
utilizes a discounted cash flow analysis of the Company’ s pension and other postretirement obligations and currently available market
and industry data. The yield curve utilized in the cash flow analysis is comprised of bonds rated Aa or higher with maturities primarily
between zero and thirty years. Based on all available information, it was determined that 6.00% and 5.75% were the appropriate
discount rates as of December 31, 2009 to calculate the Company’ s pension and other postretirement obligations, respectively.
Accordingly, the 6.00% and 5.75% discount rates will also be used to determine the Company’ s 2010 pension and other postretirement
expense, respectively. At December 31, 2008, the discount rate was 6.25% for both pension and other postretirement expense.
As of December 31, 2009, a 25 basis point increase/decrease in the discount rate would decrease/increase the pension and other
postretirement obligations by $122 and $9, respectively.
The Company determines the expected long-term rate of return assumption based on an analysis of the Plan portfolio’ s historical
compound rates of return since 1979 (the earliest date for which comparable portfolio data is available) and over 5 year and 10 year
periods. The Company selected these periods, as well as shorter durations, to assess the portfolio’ s volatility, duration and total returns
as they relate to pension obligation characteristics, which are influenced by the Company’ s workforce demographics. In addition, the
Company also applies long-term market return assumptions to an investment mix that generally anticipates 60% fixed income securities,
20% equity securities and 20% alternative assets to derive an expected long-term rate of return. Based upon these analyses,
management maintained the long-term rate of return assumption at 7.30% as of December 31, 2009. This assumption will be used to
determine the Company’ s 2010 expense. The long-term rate of return assumption at December 31, 2008, that was used to determine the
Company’ s 2009 expense, was also 7.30%.
Pension expense reflected in the Company’ s results was $137, $122 and $131 in 2009, 2008 and 2007, respectively. The Company
estimates its 2010 pension expense will be approximately $186, based on current assumptions. To illustrate the impact of these
assumptions on annual pension expense for 2010 and going forward, a 25 basis point decrease in the discount rate will increase pension
expense by approximately $14 and a 25 basis point change in the long-term asset return assumption will increase/decrease pension
expense by approximately $10.
The Company uses a five-year averaging method to determine the market-related value of Plan assets, which is used to determine the
expected return component of pension expense. Under this methodology, asset gains/losses that result from returns that differ from the
Company’ s long-term rate of return assumption are recognized in the market-related value of assets on a level basis over a five year
period. The difference between actual asset returns for the plans of $184 and $(441) for the years ended December 31, 2009 and 2008,
respectively, as compared to expected returns of $276 and $279 for the years ended December 31, 2009 and 2008, respectively, will be
fully reflected in the market-related value of plan assets over the next five years using the methodology described above. The level of
actuarial net loss continues to exceed the allowable amortization corridor. Based on the 6.00% discount rate selected as of December
31, 2009 and taking into account estimated future minimum funding, the difference between actual and expected performance in 2009
will increase annual pension expense in future years. The increase in pension expense will be approximately $3 in 2010 and will
increase ratably to an increase of approximately $16 in 2015.