The Hartford 2009 Annual Report Download - page 207
Download and view the complete annual report
Please find page 207 of the 2009 The Hartford annual report below. You can navigate through the pages in the report by either clicking on the pages listed below, or by using the keyword search tool below to find specific information within the annual report.-
 1
1 -
2
-
3
-
4
-
5
-
6
-
7
-
8
-
9
-
10
-
11
-
12
-
13
-
14
-
15
-
16
-
17
-
18
-
19
-
20
-
21
-
22
-
23
-
24
-
25
-
26
-
27
-
28
-
29
-
30
-
31
-
32
-
33
-
34
-
35
-
36
-
37
-
38
-
39
-
40
-
41
-
42
-
43
-
44
-
45
-
46
-
47
-
48
-
49
-
50
-
51
-
52
-
53
-
54
-
55
-
56
-
57
-
58
-
59
-
60
-
61
-
62
-
63
-
64
-
65
-
66
-
67
-
68
-
69
-
70
-
71
-
72
-
73
-
74
-
75
-
76
-
77
-
78
-
79
-
80
-
81
-
82
-
83
-
84
-
85
-
86
-
87
-
88
-
89
-
90
-
91
-
92
-
93
-
94
-
95
-
96
-
97
-
98
-
99
-
100
-
101
-
102
-
103
-
104
-
105
-
106
-
107
-
108
-
109
-
110
-
111
-
112
-
113
-
114
-
115
-
116
-
117
-
118
-
119
-
120
-
121
-
122
-
123
-
124
-
125
-
126
-
127
-
128
-
129
-
130
-
131
-
132
-
133
-
134
-
135
-
136
-
137
-
138
-
139
-
140
-
141
-
142
-
143
-
144
-
145
-
146
-
147
-
148
-
149
-
150
-
151
-
152
-
153
-
154
-
155
-
156
-
157
-
158
-
159
-
160
-
161
-
162
-
163
-
164
-
165
-
166
-
167
-
168
-
169
-
170
-
171
-
172
-
173
-
174
-
175
-
176
-
177
-
178
-
179
-
180
-
181
-
182
-
183
-
184
-
185
-
186
-
187
-
188
-
189
-
190
-
191
-
192
-
193
-
194
-
195
-
196
-
 197
197 -
 198
198 -
 199
199 -
 200
200 -
 201
201 -
 202
202 -
 203
203 -
 204
204 -
 205
205 -
 206
206 -
 207
207 -
 208
208 -
 209
209 -
 210
210 -
 211
211 -
 212
212 -
 213
213 -
 214
214 -
 215
215 -
 216
216 -
 217
217 -
218
-
219
-
220
-
221
-
222
-
223
-
224
-
225
-
226
-
227
-
228
-
229
-
230
-
231
-
232
-
233
-
234
-
235
-
236
-
237
-
238
-
239
-
240
-
241
-
242
-
243
-
244
-
245
-
246
-
247
-
248
-
249
-
250
-
251
-
252
-
253
-
254
-
255
-
256
-
257
-
258
-
259
-
260
-
261
-
262
-
263
-
264
-
265
-
266
-
267
 |
 |

THE HARTFORD FINANCIAL SERVICES GROUP, INC.
NOTES TO CONSOLIDATED FINANCIAL STATEMENTS (continued)
F-58
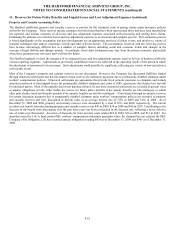
9. Separate Accounts, Death Benefits and Other Insurance Benefit Features (continued)
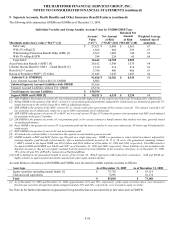
The following table summarizes GMDBs and GMIBs as of December 31, 2009:
Individual Variable and Group Annuity Account Value by GMDB/GMIB Type
Maximum anniversary value (“MAV”) [1]
Account
Value
(“AV”)
Net Amount
at Risk
(“NAR”) [10]
Retained Net
Amount
at Risk
(“RNAR”) [10]
Wei
g
hted Avera
g
e
Attained Age of
Annuitant
MAV only $ 27,423 $8,408
$
2,461 67
With 5% rollup [2] 1,868 664 259 67
With Earnings Protection Benefit Rider (EPB) [3] 6,567 1,409 140 63
With 5% rollup & EPB 784 224 45 66
Total MAV 36,642 10,705 2,905
Asset Protection Benefit (“APB”) [4] 28,612 5,508 3,535 64
Lifetime Income Benefit (“LIB”) - Death Benefit [5] 1,330 214 214 62
Reset [6] (5-7 years) 3,790 490 486 67
Return of Premium (“ROP”) [7] /Other 21,446 1,445 1,405 64
Subtotal U.S. GMDB [8] 91,820 $18,362
$
8,545 65
Less: General Account Value with U.S. GMDB 6,802
Subtotal Separate Account Liabilities with GMDB 85,018
Separate Account Liabilities without U.S. GMDB 65,376
Total Separate Account Liabilities $ 150,394
Japan GMDB and GMIB [9] $ 30,521 $ 6,335
$
5,238 68
[1] MAV GMDB is the greatest of current AV, net premiums paid and the highest AV on any anniversary before age 80 (adjusted for withdrawals).
[2] Rollup GMDB is the greatest of the MAV, current AV, net premium paid and premiums (adjusted for withdrawals) accumulated at generally 5%
simple interest up to the earlier of age 80 or 100% of adjusted premiums.
[3] EPB GMDB is the greatest of the MAV, current AV, or contract value plus a percentage of the contract’s growth. The contract’s growth is AV
less premiums net of withdrawals, subject to a cap of 200% of premiums net of withdrawals.
[4] APB GMDB is the greater of current AV or MAV, not to exceed current AV plus 25% times the greater of net premiums and MAV (each adjusted
for premiums in the past 12 months).
[5] LIB GMDB is the greatest of current AV, net premiums paid, or for certain contracts a benefit amount that ratchets over time, generally based
on market performance.
[6] Reset GMDB is the greatest of current AV, net premiums paid and the most recent five to seven year anniversary AV before age 80 (adjusted for
withdrawals).
[7] ROP GMDB is the greater of current AV and net premiums paid.
[8] AV includes the contract holder’s investment in the separate account and the general account.
[9] GMDB includes a ROP and MAV (before age 80) paid in a single lump sum. GMIB is a guarantee to return initial investment, adjusted for
earnings liquidity, paid through a fixed annuity, after a minimum deferral period of 10, 15 or 20 years. The guaranteed remaining balance
(“GRB”) related to the Japan GMIB was $28.6 billion and $30.6 billion as of December 31, 2009 and 2008, respectively. The GRB related to
the Japan GMAB and GMWB was $(648) and $567 as of December 31, 2009 and 2008, respectively. These liabilities are not included in the
Separate Account as they are not legally insulated from the general account liabilities of the insurance enterprise. As of December 31, 2009,
59% of the AV and 52% of RNAR is reinsured to a Hartford affiliate.
[10] NAR is defined as the guaranteed benefit in excess of the current AV. RNAR represents NAR reduced for reinsurance. NAR and RNAR are
highly sensitive to equity markets movements and increase when equity markets decline.
Account balances of contracts with GMDBs and GMIBs were invested in variable separate accounts as follows:
Asset type As of December 31, 2009 As of December 31, 2008
Equity securities (including mutual funds) [1] $ 75,720 $ 63,114
Cash and cash equivalents 9,298 10,174
Total $ 85,018 $ 73,288
[1] As of December 31, 2009 and December 31, 2008, approximately 16% and 16%, respectively, of the equity securities above were invested in
fixed income securities through these funds and approximately 84% and 84%, respectively, were invested in equity securities.
See Note 4a for further information on guaranteed living benefits that are accounted for at fair value such as GMWB.