The Hartford 2009 Annual Report Download - page 122
Download and view the complete annual report
Please find page 122 of the 2009 The Hartford annual report below. You can navigate through the pages in the report by either clicking on the pages listed below, or by using the keyword search tool below to find specific information within the annual report.-
 1
1 -
2
-
3
-
4
-
5
-
6
-
7
-
8
-
9
-
10
-
11
-
12
-
13
-
14
-
15
-
16
-
17
-
18
-
19
-
20
-
21
-
22
-
23
-
24
-
25
-
26
-
27
-
28
-
29
-
30
-
31
-
32
-
33
-
34
-
35
-
36
-
37
-
38
-
39
-
40
-
41
-
42
-
43
-
44
-
45
-
46
-
47
-
48
-
49
-
50
-
51
-
52
-
53
-
54
-
55
-
56
-
57
-
58
-
59
-
60
-
61
-
62
-
63
-
64
-
65
-
66
-
67
-
68
-
69
-
70
-
71
-
72
-
73
-
74
-
75
-
76
-
77
-
78
-
79
-
80
-
81
-
82
-
83
-
84
-
85
-
86
-
87
-
88
-
89
-
90
-
91
-
92
-
93
-
94
-
95
-
96
-
97
-
98
-
99
-
100
-
101
-
102
-
103
-
104
-
105
-
106
-
107
-
108
-
109
-
110
-
111
-
 112
112 -
 113
113 -
 114
114 -
 115
115 -
 116
116 -
 117
117 -
 118
118 -
 119
119 -
 120
120 -
 121
121 -
 122
122 -
 123
123 -
 124
124 -
 125
125 -
 126
126 -
 127
127 -
 128
128 -
 129
129 -
 130
130 -
 131
131 -
 132
132 -
133
-
134
-
135
-
136
-
137
-
138
-
139
-
140
-
141
-
142
-
143
-
144
-
145
-
146
-
147
-
148
-
149
-
150
-
151
-
152
-
153
-
154
-
155
-
156
-
157
-
158
-
159
-
160
-
161
-
162
-
163
-
164
-
165
-
166
-
167
-
168
-
169
-
170
-
171
-
172
-
173
-
174
-
175
-
176
-
177
-
178
-
179
-
180
-
181
-
182
-
183
-
184
-
185
-
186
-
187
-
188
-
189
-
190
-
191
-
192
-
193
-
194
-
195
-
196
-
197
-
198
-
199
-
200
-
201
-
202
-
203
-
204
-
205
-
206
-
207
-
208
-
209
-
210
-
211
-
212
-
213
-
214
-
215
-
216
-
217
-
218
-
219
-
220
-
221
-
222
-
223
-
224
-
225
-
226
-
227
-
228
-
229
-
230
-
231
-
232
-
233
-
234
-
235
-
236
-
237
-
238
-
239
-
240
-
241
-
242
-
243
-
244
-
245
-
246
-
247
-
248
-
249
-
250
-
251
-
252
-
253
-
254
-
255
-
256
-
257
-
258
-
259
-
260
-
261
-
262
-
263
-
264
-
265
-
266
-
267
 |
 |

122
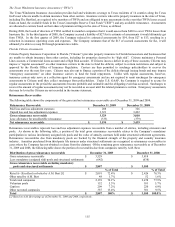
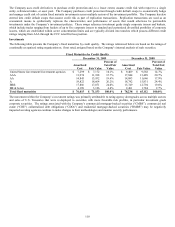
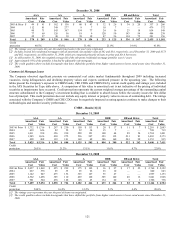
CRE CDOs [1] [2] [3] [4]
December 31, 2009
AAA AA A BBB
BB and Below Total
Amortized
Cost
Fair
Value
Amortized
Cost
Fair
Value
Amortized
Cost
Fair
Value
Amortized
Cost
Fair
Value
Amortized
Cost
Fair
Value
Amortized
Cost
Fair
Value
2003 & Prior $ 60 $ 41 $ 30 $ 15 $ 69 $ 26 $ 165 $ 44 $ 95 $ 14 $ 419 $ 140
2004 19 11 70 22 37 11 27 4 23 4 176 52
2005 17 8 72 12 35 14 49 8 26 6 199 48
2006 23 13 108 33 82 28 69 22 23 12 305 108
2007 62 33 12 3 20 5 26 9 15 10 135 60
2008 22 12 — — 5 1 15 4 13 3 55 20
2009 15 8 — — 2 — 4 1 9 2 30 11
Total $ 218 $ 126 $ 292 $ 85 $ 250 $ 85 $ 355 $ 92 $ 204 $ 51 $ 1,319 $ 439
Credit
protection 40.0% 10.5% 25.5% 34.9% 31.6% 28.1%
December 31, 2008
AAA AA A BBB
BB and Below Total
Amortized
Cost
Fair
Value
Amortized
Cost
Fair
Value
Amortized
Cost
Fair
Value
Amortized
Cost
Fair
Value
Amortized
Cost
Fair
Value
Amortized
Cost
Fair
Value
2003 & Prior $ 180 $ 59 $ 96 $ 29 $ 79 $ 17 $ 64 $ 7 $ 31 $ 7 $ 450 $ 119
2004 129 38 17 6 31 9 11 2 14 3 202 58
2005 94 37 62 15 65 12 10 2 1 — 232 66
2006 242 76 91 25 81 20 15 2 — — 429 123
2007 139 45 106 19 101 11 12 1 — — 358 76
2008 43 13 22 5 24 3 3 — — — 92 21
Total $ 827 $ 268 $ 394 $ 99 $ 381 $ 72 $ 115 $ 14 $ 46 $ 10 $ 1,763 $ 463
Credit
protection 29.7% 21.3% 18.2% 19.4% 57.0% 25.4%
[1] The vintage year represents the year that the underlying collateral in the pool was originated. Individual CDO fair value is allocated by the
proportion of collateral within each vintage year.
[2] As of December 31, 2009, approximately 42% of the underlying CRE CDOs collateral are seasoned, below investment grade securities.
[3] For certain CRE CDOs, the collateral manager has the ability to reinvest proceeds that become available, primarily from collateral maturities.
The increase in the 2008 and 2009 vintage years represents reinvestment under these CRE CDOs.
[4] The credit qualities above include downgrades that have shifted the portfolio from higher rated assets to lower rated assets since December 31,
2008.
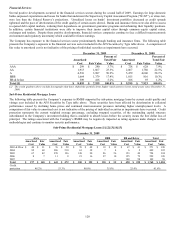
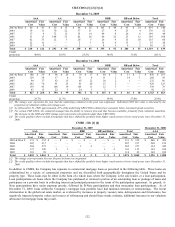
CMBS - IOs [1] [2]
December 31, 2009 December 31, 2008
AAA A BBB
BB and Below Total AAA
Amortized
Cost
Fair
Value
Amortized
Cost
Fair
Value
Amortized
Cost
Fair
Value
Amortized
Cost
Fair
Value
Amortized
Cost
Fair
Value
Amortized
Cost
Fair
Value
2003 & Prior $ 331 $ 352 $ — $ — $ — $ — $ — $ — $ 331 $ 352 $ 440 $ 423
2004 207 217 — — — — — — 207 217 268 199
2005 284 275 — — 1 2 — — 285 277 354 245
2006 137 120 3 1 — — 1 2 141 123 165 104
2007 110 99 — — — — — — 110 99 169 109
Total $ 1,069 $ 1,063 $ 3 $ 1 $ 1 $ 2 $ 1 $ 2 $ 1,074 $ 1,068 $ 1,396 $ 1,080
[1] The vintage year represents the year the pool of loans was originated.
[2] The credit qualities above include downgrades that have shifted the portfolio from higher rated assets to lower rated assets since December 31,
2008.
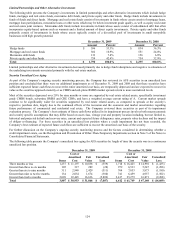
In addition to CMBS, the Company has exposure to commercial mortgage loans as presented in the following table. These loans are
collateralized by a variety of commercial properties and are diversified both geographically throughout the United States and by
property type. These loans may be either in the form of a whole loan, where the Company is the sole lender, or a loan participation.
Loan participations are loans where the Company has purchased or retained a portion of an outstanding loan or package of loans and
participates on a pro-rata basis in collecting interest and principal pursuant to the terms of the participation agreement. In general, A-
Note participations have senior payment priority, followed by B-Note participations and then mezzanine loan participations. As of
December 31, 2009, loans within the Company’ s mortgage loan portfolio have had minimal extension or restructurings. The recent
deterioration in the global real estate market, as evidenced by increases in property vacancy rates, delinquencies and foreclosures, has
negatively impacted property values and sources of refinancing and should these trends continue, additional increases in our valuation
allowance for mortgage loans may result.