The Hartford 2009 Annual Report Download - page 50
Download and view the complete annual report
Please find page 50 of the 2009 The Hartford annual report below. You can navigate through the pages in the report by either clicking on the pages listed below, or by using the keyword search tool below to find specific information within the annual report.-
 1
1 -
2
-
3
-
4
-
5
-
6
-
7
-
8
-
9
-
10
-
11
-
12
-
13
-
14
-
15
-
16
-
17
-
18
-
19
-
20
-
21
-
22
-
23
-
24
-
25
-
26
-
27
-
28
-
29
-
30
-
31
-
32
-
33
-
34
-
35
-
36
-
37
-
38
-
39
-
 40
40 -
 41
41 -
 42
42 -
 43
43 -
 44
44 -
 45
45 -
 46
46 -
 47
47 -
 48
48 -
 49
49 -
 50
50 -
 51
51 -
 52
52 -
 53
53 -
 54
54 -
 55
55 -
 56
56 -
 57
57 -
 58
58 -
 59
59 -
 60
60 -
61
-
62
-
63
-
64
-
65
-
66
-
67
-
68
-
69
-
70
-
71
-
72
-
73
-
74
-
75
-
76
-
77
-
78
-
79
-
80
-
81
-
82
-
83
-
84
-
85
-
86
-
87
-
88
-
89
-
90
-
91
-
92
-
93
-
94
-
95
-
96
-
97
-
98
-
99
-
100
-
101
-
102
-
103
-
104
-
105
-
106
-
107
-
108
-
109
-
110
-
111
-
112
-
113
-
114
-
115
-
116
-
117
-
118
-
119
-
120
-
121
-
122
-
123
-
124
-
125
-
126
-
127
-
128
-
129
-
130
-
131
-
132
-
133
-
134
-
135
-
136
-
137
-
138
-
139
-
140
-
141
-
142
-
143
-
144
-
145
-
146
-
147
-
148
-
149
-
150
-
151
-
152
-
153
-
154
-
155
-
156
-
157
-
158
-
159
-
160
-
161
-
162
-
163
-
164
-
165
-
166
-
167
-
168
-
169
-
170
-
171
-
172
-
173
-
174
-
175
-
176
-
177
-
178
-
179
-
180
-
181
-
182
-
183
-
184
-
185
-
186
-
187
-
188
-
189
-
190
-
191
-
192
-
193
-
194
-
195
-
196
-
197
-
198
-
199
-
200
-
201
-
202
-
203
-
204
-
205
-
206
-
207
-
208
-
209
-
210
-
211
-
212
-
213
-
214
-
215
-
216
-
217
-
218
-
219
-
220
-
221
-
222
-
223
-
224
-
225
-
226
-
227
-
228
-
229
-
230
-
231
-
232
-
233
-
234
-
235
-
236
-
237
-
238
-
239
-
240
-
241
-
242
-
243
-
244
-
245
-
246
-
247
-
248
-
249
-
250
-
251
-
252
-
253
-
254
-
255
-
256
-
257
-
258
-
259
-
260
-
261
-
262
-
263
-
264
-
265
-
266
-
267
 |
 |

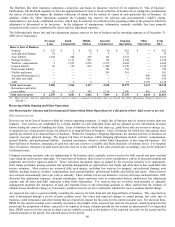
50
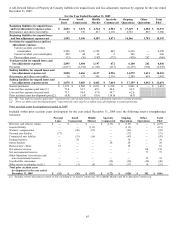
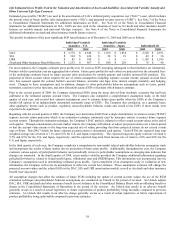
A rollforward of liabilities for unpaid losses and loss adjustment expenses by segment for Property & Casualty for the year ended
December 31, 2007 follows:
For the year ended December 31, 2007
Personal
Lines
Small
Commercial
Middle
Market
Specialty
Commercial
Ongoing
Operations
Other
Operations
Total
P&C
Beginning liabilities for unpaid losses
and loss adjustment expenses-gross
$
1,959 $
3,421 $
4,536
$
6,359 $
16,275
$
5,716
$ 21,991
Reinsurance and other recoverables 134 214 479 2,260 3,087 1,300 4,387
Beginning liabilities for unpaid losses
and loss adjustment expenses-net
1,825
3,207
4,057
4,099
13,188
4,416
17,604
Provision for unpaid losses and loss
adjustment expenses
Current accident year before
catastrophes
2,576
1,594
1,561
961
6,692
—
6,692
Current accident year catastrophes 125 28 15 9 177 — 177
Prior accident years (4) (209) (16) 84 (145) 193 48
Total provision for unpaid losses and
loss adjustment expenses
2,697
1,413
1,560 1,054
6,724
193
6,917
Payments (2,503) (1,222) (1,248) (720) (5,693) (597) (6,290)
Reallocation of reserves for unallocated
loss adjustment expenses [1]
(58)
(105)
(86) 124
(125)
125
—
Ending liabilities for unpaid losses and
loss adjustment expenses-net
1,961
3,293
4,283
4,557
14,094
4,137
18,231
Reinsurance and other recoverables 81 177 414 2,316 2,988 934 3,922
Ending liabilities for unpaid losses and
loss adjustment expenses-gross
$
2,042 $
3,470
$
4,697
$
6,873 $
17,082
$
5,071
$ 22,153
Earned premiums $ 3,889 $2,736 $2,420 $1,446 $ 10,491 $ 5 $ 10,496
Loss and loss expense paid ratio [2] 64.4 44.7 51.5 49.8 54.3
Loss and loss expense incurred ratio 69.3 51.6 64.5 73.0 64.1
Prior accident year development (pts.) [3] (0.1) (7.6) (0.7) 5.8 (1.4)
[1] Prior to the second quarter of 2007, the Company evaluated the adequacy of the reserves for unallocated loss adjustment expenses on a company-
wide basis. During the second quarter of 2007, the Company refined its analysis of the reserves at the segment level, resulting in the reallocation
of reserves among segments, including a reallocation of reserves from Ongoing Operations to Other Operations.
[2] The “loss and loss expense paid ratio” represents the ratio of paid loss and loss adjustment expenses to earned premiums.
[3] “Prior accident year development (pts)” represents the ratio of prior accident year development to earned premiums.
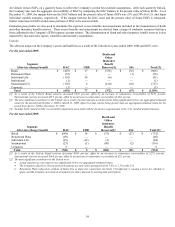
Prior accident years development recorded in 2007
Included within prior accident years development for the year ended December 31, 2007 were the following reserve strengthenings
(releases).
Personal
Lines
Small
Commercial
Middle
Market
Specialty
Commercial
Ongoing
Operations
Other
Operations
Total
P&C
Workers’ compensation $ — $ (184) $ 40 $ 47 $ (97) $ — $ (97)
Package business liability — (30) — — (30) — (30)
Surety business — — — (22) (22) — (22)
Commercial auto liability — — (18) — (18) — (18)
Personal auto liability (16) — — — (16) — (16)
Errors and omissions — — — (15) (15) — (15)
Adverse arbitration decision — — — — — 99 99
General liability — — (35) 59 24 — 24
Net environmental reserves — — — — — 25 25
Other reserve re-estimates, net [1] 12 5 (3) 15 29 69 98
Total prior accident years
development for the year
ended December 31, 2007
$
(4)
$
(209)
$
(16)
$
84
$
(145)
$
193
$
48
[1] Includes reserve discount accretion of $31, including $6 in Small Commercial, $8 in Middle Market, $11 in Specialty Commercial and $6 in Other
Operations.