The Hartford 2009 Annual Report Download - page 29
Download and view the complete annual report
Please find page 29 of the 2009 The Hartford annual report below. You can navigate through the pages in the report by either clicking on the pages listed below, or by using the keyword search tool below to find specific information within the annual report.-
 1
1 -
2
-
3
-
4
-
5
-
6
-
7
-
8
-
9
-
10
-
11
-
12
-
13
-
14
-
15
-
16
-
17
-
18
-
 19
19 -
 20
20 -
 21
21 -
 22
22 -
 23
23 -
 24
24 -
 25
25 -
 26
26 -
 27
27 -
 28
28 -
 29
29 -
 30
30 -
 31
31 -
 32
32 -
 33
33 -
 34
34 -
 35
35 -
 36
36 -
 37
37 -
 38
38 -
 39
39 -
40
-
41
-
42
-
43
-
44
-
45
-
46
-
47
-
48
-
49
-
50
-
51
-
52
-
53
-
54
-
55
-
56
-
57
-
58
-
59
-
60
-
61
-
62
-
63
-
64
-
65
-
66
-
67
-
68
-
69
-
70
-
71
-
72
-
73
-
74
-
75
-
76
-
77
-
78
-
79
-
80
-
81
-
82
-
83
-
84
-
85
-
86
-
87
-
88
-
89
-
90
-
91
-
92
-
93
-
94
-
95
-
96
-
97
-
98
-
99
-
100
-
101
-
102
-
103
-
104
-
105
-
106
-
107
-
108
-
109
-
110
-
111
-
112
-
113
-
114
-
115
-
116
-
117
-
118
-
119
-
120
-
121
-
122
-
123
-
124
-
125
-
126
-
127
-
128
-
129
-
130
-
131
-
132
-
133
-
134
-
135
-
136
-
137
-
138
-
139
-
140
-
141
-
142
-
143
-
144
-
145
-
146
-
147
-
148
-
149
-
150
-
151
-
152
-
153
-
154
-
155
-
156
-
157
-
158
-
159
-
160
-
161
-
162
-
163
-
164
-
165
-
166
-
167
-
168
-
169
-
170
-
171
-
172
-
173
-
174
-
175
-
176
-
177
-
178
-
179
-
180
-
181
-
182
-
183
-
184
-
185
-
186
-
187
-
188
-
189
-
190
-
191
-
192
-
193
-
194
-
195
-
196
-
197
-
198
-
199
-
200
-
201
-
202
-
203
-
204
-
205
-
206
-
207
-
208
-
209
-
210
-
211
-
212
-
213
-
214
-
215
-
216
-
217
-
218
-
219
-
220
-
221
-
222
-
223
-
224
-
225
-
226
-
227
-
228
-
229
-
230
-
231
-
232
-
233
-
234
-
235
-
236
-
237
-
238
-
239
-
240
-
241
-
242
-
243
-
244
-
245
-
246
-
247
-
248
-
249
-
250
-
251
-
252
-
253
-
254
-
255
-
256
-
257
-
258
-
259
-
260
-
261
-
262
-
263
-
264
-
265
-
266
-
267
 |
 |

29
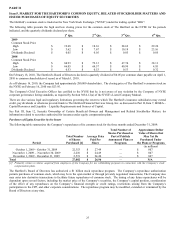
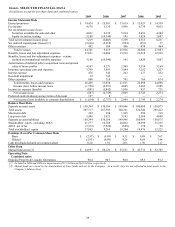
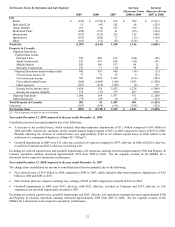
Item 6. SELECTED FINANCIAL DATA
(In millions, except for per share data and combined ratios)
2009 2008 2007 2006 2005
Income Statement Data
Earned premiums $14,424 $15,503 $15,619 $ 15,023 $14,359
Fee income 4,576 5,135 5,436 4,739 4,012
Net investment income (loss):
Securities available-for-sale and other 4,031 4,335 5,214 4,691 4,384
Equity securities, trading 3,188 (10,340) 145 1,824 3,847
Total net investment income (loss) 7,219 (6,005) 5,359 6,515 8,231
Net realized capital gains (losses) [1] (2,010) (5,918) (994) (251) 17
Other revenues 492 504 496 474 464
Total revenues 24,701 9,219 25,916 26,500 27,083
Benefits, losses and loss adjustment expenses 13,831 14,088 13,919 13,218 12,929
Benefits, losses and loss adjustment expenses – returns
credited on International variable annuities 3,188 (10,340) 145 1,824 3,847
Amortization of deferred policy acquisition costs and present
value of future profits 4,267 4,271 2,989 3,558 3,169
Insurance operating costs and expenses 3,749 3,993 3,894 3,252 3,227
Interest expense 476 343 263 277 252
Goodwill impairment 32 745 — — —
Other expenses 886 710 701 769 674
Total benefits, losses and expenses 26,429 13,810 21,911 22,898 24,098
Income (loss) before income taxes (1,728) (4,591) 4,005 3,602 2,985
Income tax expense (benefit) (841) (1,842) 1,056 857 711
Net income (loss) (887) (2,749) 2,949 2,745 2,274
Preferred stock dividends and accretion of discount 127 8 — — —
Net income (loss) available to common shareholders $(1,014) $(2,757) $2,949 $ 2,745 $2,274
Balance Sheet Data
Separate account assets $150,394 $130,184 $199,946 $ 180,484 $150,875
Total assets 307,717 287,583 360,361 326,544 285,412
Short-term debt 343 398 1,365 599 719
Long-term debt 5,496 5,823 3,142 3,504 4,048
Separate account liabilities 150,394 130,184 199,946 180,484 150,875
Stockholders’ equity, excluding AOCI 21,177 16,788 20,062 18,698 15,235
AOCI, net of tax (3,312) (7,520) (858) 178 90
Total stockholders’ equity 17,865 9,268 19,204 18,876 15,325
Earnings (Loss) Per Common Share Data
Basic $(2.93) $(8.99) $9.32 $ 8.89 $7.63
Diluted (2.93) (8.99) 9.24 8.69 7.44
Cash dividends declared per common share 0.20 1.91 2.03 1.70 1.17
Other Data
Mutual fund assets [2] $ 64,997 $ 50,126 $ 55,531 $ 43,732 $ 32,705
Operating Data
Combined ratios
Ongoing Property & Casualty Operations 90.4 90.7 90.8 89.3 93.2
[1] Included in 2009 and 2008 are impairments of $1.5 billion and $4.0 billion, respectively.
[2] Mutual funds are owned by the shareholders of those funds and not by the Company. As a result, they are not reflected in total assets in the
Company’s balance sheet.