The Hartford 2009 Annual Report Download - page 156
Download and view the complete annual report
Please find page 156 of the 2009 The Hartford annual report below. You can navigate through the pages in the report by either clicking on the pages listed below, or by using the keyword search tool below to find specific information within the annual report.-
 1
1 -
2
-
3
-
4
-
5
-
6
-
7
-
8
-
9
-
10
-
11
-
12
-
13
-
14
-
15
-
16
-
17
-
18
-
19
-
20
-
21
-
22
-
23
-
24
-
25
-
26
-
27
-
28
-
29
-
30
-
31
-
32
-
33
-
34
-
35
-
36
-
37
-
38
-
39
-
40
-
41
-
42
-
43
-
44
-
45
-
46
-
47
-
48
-
49
-
50
-
51
-
52
-
53
-
54
-
55
-
56
-
57
-
58
-
59
-
60
-
61
-
62
-
63
-
64
-
65
-
66
-
67
-
68
-
69
-
70
-
71
-
72
-
73
-
74
-
75
-
76
-
77
-
78
-
79
-
80
-
81
-
82
-
83
-
84
-
85
-
86
-
87
-
88
-
89
-
90
-
91
-
92
-
93
-
94
-
95
-
96
-
97
-
98
-
99
-
100
-
101
-
102
-
103
-
104
-
105
-
106
-
107
-
108
-
109
-
110
-
111
-
112
-
113
-
114
-
115
-
116
-
117
-
118
-
119
-
120
-
121
-
122
-
123
-
124
-
125
-
126
-
127
-
128
-
129
-
130
-
131
-
132
-
133
-
134
-
135
-
136
-
137
-
138
-
139
-
140
-
141
-
142
-
143
-
144
-
145
-
 146
146 -
 147
147 -
 148
148 -
 149
149 -
 150
150 -
 151
151 -
 152
152 -
 153
153 -
 154
154 -
 155
155 -
 156
156 -
 157
157 -
 158
158 -
 159
159 -
 160
160 -
 161
161 -
 162
162 -
 163
163 -
 164
164 -
 165
165 -
 166
166 -
167
-
168
-
169
-
170
-
171
-
172
-
173
-
174
-
175
-
176
-
177
-
178
-
179
-
180
-
181
-
182
-
183
-
184
-
185
-
186
-
187
-
188
-
189
-
190
-
191
-
192
-
193
-
194
-
195
-
196
-
197
-
198
-
199
-
200
-
201
-
202
-
203
-
204
-
205
-
206
-
207
-
208
-
209
-
210
-
211
-
212
-
213
-
214
-
215
-
216
-
217
-
218
-
219
-
220
-
221
-
222
-
223
-
224
-
225
-
226
-
227
-
228
-
229
-
230
-
231
-
232
-
233
-
234
-
235
-
236
-
237
-
238
-
239
-
240
-
241
-
242
-
243
-
244
-
245
-
246
-
247
-
248
-
249
-
250
-
251
-
252
-
253
-
254
-
255
-
256
-
257
-
258
-
259
-
260
-
261
-
262
-
263
-
264
-
265
-
266
-
267
 |
 |

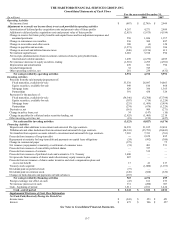
F-7
THE HARTFORD FINANCIAL SERVICES GROUP, INC.
Consolidated Statements of Cash Flows
For the years ended December 31,
(In millions) 2009 2008 2007
Operating Activities
Net income (loss) $ (887) $ (2,749) $ 2,949
Adjustments to reconcile net income (loss) to net cash provided by operating activities
Amortization of deferred policy acquisition costs and present value of future profits 4,267 4,271 2,989
Additions to deferred policy acquisition costs and present value of future profits (2,853) (3,675) (4,194)
Change in reserve for future policy benefits and unpaid losses and loss adjustment expenses and
unearned premiums
558 1,026 1,357
Change in reinsurance recoverables 236 300 487
Change in receivables and other assets 380 (4) 128
Change in payables and accruals (1,271) (103) 306
Change in accrued and deferred income taxes (246) (2,156) 619
Net realized capital losses 2,010 5,918 994
Net receipts (disbursements) from investment contracts related to policyholder funds -
International variable annuities
1,498 (2,276) 4,695
Net (increase) decrease in equity securities, trading (1,501) 2,295 (4,701)
Depreciation and amortization 470 361 794
Goodwill impairment 32 745 —
Other operating activities, net 281 239 (432)
Net cash provided by operating activities 2,974 4,192 5,991
Investing Activities
Proceeds from the sale/maturity/prepayment of:
Fixed maturities, available-for-sale 53,538 26,097 34,063
Equity securities, available-for-sale 949 616 468
Mortgage loans 629 386 1,365
Partnerships 391 438 324
Payments for the purchase of:
Fixed maturities, available-for-sale (54,346) (32,708) (37,799)
Equity securities, available-for-sale (307) (714) (1,224)
Mortgage loans (233) (1,469) (3,454)
Partnerships (274) (678) (1,229)
Derivatives, net (561) 909 (271)
Change in policy loans, net 34 (147) (10)
Change in payables for collateral under securities lending, net (2,925) (1,405) 2,218
Other investing activities, net (18) (152) (627)
Net cash used for investing activities (3,123) (8,827) (6,176)
Financing Activities
Deposits and other additions to investment and universal life-type contracts 14,239 21,015 32,494
Withdrawals and other deductions from investment and universal life-type contracts (24,341) (25,793) (30,443)
Net transfers from separate accounts related to investment and universal life-type contracts 7,203 7,353 (761)
Proceeds from issuance of long-term debt —
2,670 495
Repayments at maturity for long-term debt and payments on capital lease obligations (24) (992) (300)
Change in commercial paper (375) — 75
Net issuance (repayments) at maturity or settlement of consumer notes (74) 401 551
Proceeds from issuance of convertible preferred shares — 727 —
Proceeds from issuance of warrants — 512 —
Proceeds from issuance of preferred stock and warrants to U.S. Treasury 3,400 — —
Net proceeds from issuance of shares under discretionary equity issuance plan 887 — —
Proceeds from net issuance of shares under incentive and stock compensation plans and
excess tax benefit
17 41 217
Treasury stock acquired — (1,000) (1,193)
Dividends paid on preferred stock (73) — —
Dividends paid on common stock (149) (660) (636)
Changes in bank deposits and payments on bank advances (187) — —
Net cash provided by financing activities 523 4,274 499
Foreign exchange rate effect on cash (43) 161 273
Net increase (decrease) in cash 331 (200) 587
Cash - beginning of period 1,811 2,011 1,424
Cash - end of period $ 2,142 $ 1,811 $ 2,011
Supplemental Disclosure of Cash Flow Information
Net Cash Paid (Received) During the Period For:
Income taxes $ (243) $ 253 $ 451
Interest $ 475 $ 286 $ 257
See Notes to Consolidated Financial Statements.