The Hartford 2009 Annual Report Download - page 104
Download and view the complete annual report
Please find page 104 of the 2009 The Hartford annual report below. You can navigate through the pages in the report by either clicking on the pages listed below, or by using the keyword search tool below to find specific information within the annual report.-
 1
1 -
2
-
3
-
4
-
5
-
6
-
7
-
8
-
9
-
10
-
11
-
12
-
13
-
14
-
15
-
16
-
17
-
18
-
19
-
20
-
21
-
22
-
23
-
24
-
25
-
26
-
27
-
28
-
29
-
30
-
31
-
32
-
33
-
34
-
35
-
36
-
37
-
38
-
39
-
40
-
41
-
42
-
43
-
44
-
45
-
46
-
47
-
48
-
49
-
50
-
51
-
52
-
53
-
54
-
55
-
56
-
57
-
58
-
59
-
60
-
61
-
62
-
63
-
64
-
65
-
66
-
67
-
68
-
69
-
70
-
71
-
72
-
73
-
74
-
75
-
76
-
77
-
78
-
79
-
80
-
81
-
82
-
83
-
84
-
85
-
86
-
87
-
88
-
89
-
90
-
91
-
92
-
93
-
 94
94 -
 95
95 -
 96
96 -
 97
97 -
 98
98 -
 99
99 -
 100
100 -
 101
101 -
 102
102 -
 103
103 -
 104
104 -
 105
105 -
 106
106 -
 107
107 -
 108
108 -
 109
109 -
 110
110 -
 111
111 -
 112
112 -
 113
113 -
 114
114 -
115
-
116
-
117
-
118
-
119
-
120
-
121
-
122
-
123
-
124
-
125
-
126
-
127
-
128
-
129
-
130
-
131
-
132
-
133
-
134
-
135
-
136
-
137
-
138
-
139
-
140
-
141
-
142
-
143
-
144
-
145
-
146
-
147
-
148
-
149
-
150
-
151
-
152
-
153
-
154
-
155
-
156
-
157
-
158
-
159
-
160
-
161
-
162
-
163
-
164
-
165
-
166
-
167
-
168
-
169
-
170
-
171
-
172
-
173
-
174
-
175
-
176
-
177
-
178
-
179
-
180
-
181
-
182
-
183
-
184
-
185
-
186
-
187
-
188
-
189
-
190
-
191
-
192
-
193
-
194
-
195
-
196
-
197
-
198
-
199
-
200
-
201
-
202
-
203
-
204
-
205
-
206
-
207
-
208
-
209
-
210
-
211
-
212
-
213
-
214
-
215
-
216
-
217
-
218
-
219
-
220
-
221
-
222
-
223
-
224
-
225
-
226
-
227
-
228
-
229
-
230
-
231
-
232
-
233
-
234
-
235
-
236
-
237
-
238
-
239
-
240
-
241
-
242
-
243
-
244
-
245
-
246
-
247
-
248
-
249
-
250
-
251
-
252
-
253
-
254
-
255
-
256
-
257
-
258
-
259
-
260
-
261
-
262
-
263
-
264
-
265
-
266
-
267
 |
 |

104
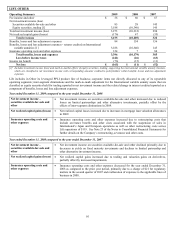
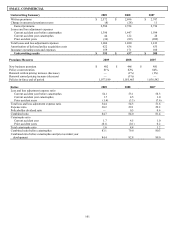
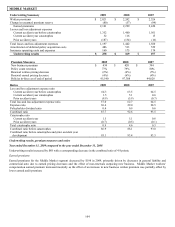
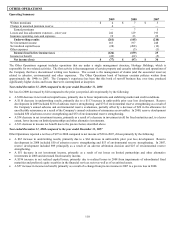
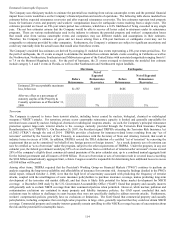
MIDDLE MARKET
Underwriting Summary 2009 2008 2007
Written premiums $ 2,021 $ 2,242 $ 2,326
Change in unearned premium reserve (80) (57) (94)
Earned premiums 2,101 2,299 2,420
Losses and loss adjustment expenses
Current accident year before catastrophes 1,352 1,460 1,561
Current accident year catastrophes 32 116 15
Prior accident years (187) (134) (16)
Total losses and loss adjustment expenses 1,197 1,442 1,560
Amortization of deferred policy acquisition costs 486 513 529
Insurance operating costs and expenses 160 175 174
Underwriting results $ 258 $ 169 $ 157
Premium Measures 2009 2008 2007
New business premium $434 $420 $ 394
Policy count retention 77% 79% 80%
Renewal written pricing decrease (2%) (6%) (5%)
Renewal earned pricing decrease (4%) (6%) (4%)
Policies in-force as of end of period 95,540 97,308 94,828
Ratios 2009 2008 2007
Loss and loss adjustment expense ratio
Current accident year before catastrophes 64.3 63.5 64.5
Current accident year catastrophes 1.5 5.1 0.6
Prior accident years (8.9) (5.9) (0.7)
Total loss and loss adjustment expense ratio 57.0 62.7 64.5
Expense ratio 30.4 29.0 28.5
Policyholder dividend ratio 0.4 0.9 0.6
Combined ratio 87.7 92.6 93.5
Catastrophe ratio
Current accident year 1.5 5.1 0.6
Prior accident years (0.7) (0.5) (0.1)
Total catastrophe ratio 0.9 4.6 0.5
Combined ratio before catastrophes 86.9 88.1 93.0
Combined ratio before catastrophes and prior accident year
development 95.1 93.4 93.5
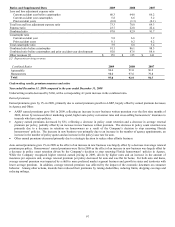
Underwriting results, premium measures and ratios
Year ended December 31, 2009 compared to the year ended December 31, 2008
Underwriting results increased by $89 with a corresponding decrease in the combined ratio of 4.9 points.
Earned premiums
Earned premiums for the Middle Market segment decreased by $198 in 2009, primarily driven by decreases in general liability and
commercial auto due to earned pricing decreases and the effect of non-renewals outpacing new business. Middle Market workers’
compensation earned premium increased modestly as the effect of an increase in new business written premium was partially offset by
lower earned audit premium.