The Hartford 2009 Annual Report Download - page 73
Download and view the complete annual report
Please find page 73 of the 2009 The Hartford annual report below. You can navigate through the pages in the report by either clicking on the pages listed below, or by using the keyword search tool below to find specific information within the annual report.-
 1
1 -
2
-
3
-
4
-
5
-
6
-
7
-
8
-
9
-
10
-
11
-
12
-
13
-
14
-
15
-
16
-
17
-
18
-
19
-
20
-
21
-
22
-
23
-
24
-
25
-
26
-
27
-
28
-
29
-
30
-
31
-
32
-
33
-
34
-
35
-
36
-
37
-
38
-
39
-
40
-
41
-
42
-
43
-
44
-
45
-
46
-
47
-
48
-
49
-
50
-
51
-
52
-
53
-
54
-
55
-
56
-
57
-
58
-
59
-
60
-
61
-
62
-
 63
63 -
 64
64 -
 65
65 -
 66
66 -
 67
67 -
 68
68 -
 69
69 -
 70
70 -
 71
71 -
 72
72 -
 73
73 -
 74
74 -
 75
75 -
 76
76 -
 77
77 -
 78
78 -
 79
79 -
 80
80 -
 81
81 -
 82
82 -
 83
83 -
84
-
85
-
86
-
87
-
88
-
89
-
90
-
91
-
92
-
93
-
94
-
95
-
96
-
97
-
98
-
99
-
100
-
101
-
102
-
103
-
104
-
105
-
106
-
107
-
108
-
109
-
110
-
111
-
112
-
113
-
114
-
115
-
116
-
117
-
118
-
119
-
120
-
121
-
122
-
123
-
124
-
125
-
126
-
127
-
128
-
129
-
130
-
131
-
132
-
133
-
134
-
135
-
136
-
137
-
138
-
139
-
140
-
141
-
142
-
143
-
144
-
145
-
146
-
147
-
148
-
149
-
150
-
151
-
152
-
153
-
154
-
155
-
156
-
157
-
158
-
159
-
160
-
161
-
162
-
163
-
164
-
165
-
166
-
167
-
168
-
169
-
170
-
171
-
172
-
173
-
174
-
175
-
176
-
177
-
178
-
179
-
180
-
181
-
182
-
183
-
184
-
185
-
186
-
187
-
188
-
189
-
190
-
191
-
192
-
193
-
194
-
195
-
196
-
197
-
198
-
199
-
200
-
201
-
202
-
203
-
204
-
205
-
206
-
207
-
208
-
209
-
210
-
211
-
212
-
213
-
214
-
215
-
216
-
217
-
218
-
219
-
220
-
221
-
222
-
223
-
224
-
225
-
226
-
227
-
228
-
229
-
230
-
231
-
232
-
233
-
234
-
235
-
236
-
237
-
238
-
239
-
240
-
241
-
242
-
243
-
244
-
245
-
246
-
247
-
248
-
249
-
250
-
251
-
252
-
253
-
254
-
255
-
256
-
257
-
258
-
259
-
260
-
261
-
262
-
263
-
264
-
265
-
266
-
267
 |
 |

73
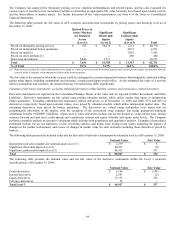
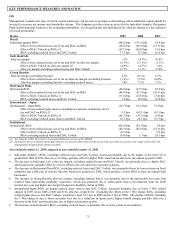
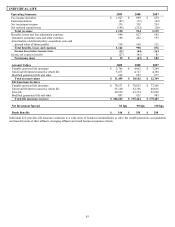
KEY PERFORMANCE MEASURES AND RATIOS
Life
Management evaluates the rates of return various businesses can provide as an input in determining where additional capital should be
invested to increase net income and shareholder returns. The Company uses the return on assets for the Individual Annuity, Retirement
Plans and Institutional businesses for evaluating profitability. In Group Benefits and Individual Life, after-tax margin is a key indicator
of overall profitability.
Ratios 2009 2008 2007
Retail
Individual annuity ROA (48.6) bps (133.5) bps 58.9 bps
Effect of net realized losses, net of tax and DAC on ROA (18.8) bps (96.5) bps (13.3) bps
Effect of DAC Unlock on ROA [1] (67.1) bps (68.0) bps 15.6 bps
ROA excluding realized losses and DAC Unlock 37.3 bps 31.0 bps 56.6 bps
Individual Life
After-tax margin 1.3% (4.7%) 16.0%
Effect of net realized losses, net of tax and DAC on after-tax margin (6.5%) (13.1%) (1.3%)
Effect of DAC Unlock on after-tax margin [1] (4.9%) (4.7%) 1.4%
After-tax margin excluding realized losses and DAC Unlock 12.7% 13.1% 15.9%
Group Benefits
After-tax margin (excluding buyouts) 4.2% (0.1%) 6.7%
Effect of net realized losses, net of tax on after-tax margin (excluding buyouts) (1.6%) (7.3%) (0.4%)
After-tax margin (excluding buyouts) excluding realized losses 5.8% 7.2% 7.1%
Retirement Plans
Retirement ROA (54.8) bps (47.9) bps 22.9 bps
Effect of net realized losses, net of tax and DAC on ROA (44.8) bps (51.5) bps (10.5) bps
Effect of DAC Unlock on ROA [1] (13.8) bps (15.0) bps (3.4) bps
ROA excluding realized losses and DAC Unlock 3.8 bps 18.6 bps 36.8 bps
International – Japan
International – Japan ROA (16.7) bps (72.9) bps 73.4 bps
Effect of net realized gains (losses) excluding net periodic settlements, net of
tax and DAC on ROA [2] 9.5 bps (65.1) bps (8.1) bps
Effect of DAC Unlock on ROA [1] (68.3) bps (31.9) bps 6.4 bps
ROA excluding realized gains (losses) and DAC Unlock 42.1 bps 24.1 bps 75.1 bps
Institutional
Institutional ROA (86.5) bps (83.3) bps 3.0 bps
Effect of net realized losses, net of tax and DAC on ROA (80.3) bps (85.0) bps (21.5) bps
Effect of DAC Unlock on ROA [1] (0.2) bps — 0.2 bps
ROA excluding realized losses and DAC Unlock (6.0) bps 1.7 bps 24.3 bps
[1] See Unlocks within the Critical Accounting Estimates section of the MD&A.
[2] Included in the net realized capital gain (losses) are amounts that represent the net periodic accruals on currency rate swaps used in the risk
management of Japan fixed annuity products.
Year ended December 31, 2009 compared to year ended December 31, 2008
• Individual Annuity’ s ROA, excluding realized losses and DAC Unlock, increased primarily due to the impact of the write off of
goodwill in 2008 of $274 after-tax or 19.4 bps, partially offset by higher DAC amortization and lower investment spread in 2009.
• The decrease in Individual Life’ s after-tax margin, excluding realized losses and DAC Unlock, was primarily due to a higher DAC
amortization rate, partially offset by a lower effective tax rate and lower operating expenses.
• The decrease in Retirement Plans ROA, excluding realized losses and DAC Unlock, was primarily driven by lower returns on fixed
maturities and a full year of activity from the businesses acquired in 2008, which produce a lower ROA as they are mutual fund
businesses.
• The decrease in Group Benefits after-tax margin, excluding realized losses, was primarily due to the unfavorable loss ratio, that
resulted from unfavorable morbidity experience, which was primarily due to unfavorable reserve development from the 2008
incurral loss year and higher new incurred long-term disability claims in 2009.
• International-Japan ROA, excluding realized gains (losses) and DAC Unlock, increased primarily due to lower 3 Win related
charges in 2009 versus 2008 of $40 and $152, after-tax, respectively. Excluding the effects of the 3 Win charge, ROA, excluding
realized gains (losses) and DAC Unlock, would have been 53.7 bps in 2009 and 66.3 bps in 2008. The decline of ROA excluding
the 3 Win charge is due to lower surrender fees due to a reduction in lapses and a higher benefit margin, partially offset by a
decrease in the DAC amortization rate due to higher actual gross profits.
• The decrease in Institutional’ s ROA, excluding realized losses, is primarily due to lower yields on investments.