The Hartford 2009 Annual Report Download - page 161
Download and view the complete annual report
Please find page 161 of the 2009 The Hartford annual report below. You can navigate through the pages in the report by either clicking on the pages listed below, or by using the keyword search tool below to find specific information within the annual report.-
 1
1 -
2
-
3
-
4
-
5
-
6
-
7
-
8
-
9
-
10
-
11
-
12
-
13
-
14
-
15
-
16
-
17
-
18
-
19
-
20
-
21
-
22
-
23
-
24
-
25
-
26
-
27
-
28
-
29
-
30
-
31
-
32
-
33
-
34
-
35
-
36
-
37
-
38
-
39
-
40
-
41
-
42
-
43
-
44
-
45
-
46
-
47
-
48
-
49
-
50
-
51
-
52
-
53
-
54
-
55
-
56
-
57
-
58
-
59
-
60
-
61
-
62
-
63
-
64
-
65
-
66
-
67
-
68
-
69
-
70
-
71
-
72
-
73
-
74
-
75
-
76
-
77
-
78
-
79
-
80
-
81
-
82
-
83
-
84
-
85
-
86
-
87
-
88
-
89
-
90
-
91
-
92
-
93
-
94
-
95
-
96
-
97
-
98
-
99
-
100
-
101
-
102
-
103
-
104
-
105
-
106
-
107
-
108
-
109
-
110
-
111
-
112
-
113
-
114
-
115
-
116
-
117
-
118
-
119
-
120
-
121
-
122
-
123
-
124
-
125
-
126
-
127
-
128
-
129
-
130
-
131
-
132
-
133
-
134
-
135
-
136
-
137
-
138
-
139
-
140
-
141
-
142
-
143
-
144
-
145
-
146
-
147
-
148
-
149
-
150
-
 151
151 -
 152
152 -
 153
153 -
 154
154 -
 155
155 -
 156
156 -
 157
157 -
 158
158 -
 159
159 -
 160
160 -
 161
161 -
 162
162 -
 163
163 -
 164
164 -
 165
165 -
 166
166 -
 167
167 -
 168
168 -
 169
169 -
 170
170 -
 171
171 -
172
-
173
-
174
-
175
-
176
-
177
-
178
-
179
-
180
-
181
-
182
-
183
-
184
-
185
-
186
-
187
-
188
-
189
-
190
-
191
-
192
-
193
-
194
-
195
-
196
-
197
-
198
-
199
-
200
-
201
-
202
-
203
-
204
-
205
-
206
-
207
-
208
-
209
-
210
-
211
-
212
-
213
-
214
-
215
-
216
-
217
-
218
-
219
-
220
-
221
-
222
-
223
-
224
-
225
-
226
-
227
-
228
-
229
-
230
-
231
-
232
-
233
-
234
-
235
-
236
-
237
-
238
-
239
-
240
-
241
-
242
-
243
-
244
-
245
-
246
-
247
-
248
-
249
-
250
-
251
-
252
-
253
-
254
-
255
-
256
-
257
-
258
-
259
-
260
-
261
-
262
-
263
-
264
-
265
-
266
-
267
 |
 |

THE HARTFORD FINANCIAL SERVICES GROUP, INC.
NOTES TO CONSOLIDATED FINANCIAL STATEMENTS (continued)
F-12
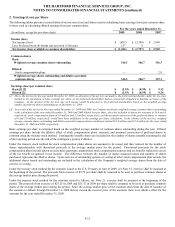
2. Earnings (Loss) per Share
The following tables present a reconciliation of net income (loss) and shares used in calculating basic earnings (loss) per common share
to those used in calculating diluted earnings (loss) per common share.
For the years ended December 31,
(In millions, except for per share data) 2009 2008 2007
Income (loss)
Net income (loss) $ (887) $ (2,749) $ 2,949
Less: Preferred stock dividends and accretion of discount 127 8 —
Net income (loss) available to common shareholders $ (1,014) $ (2,757) $ 2,949
Common shares
Basic
Weighted average common shares outstanding 346.3 306.7 316.3
Diluted
Stock compensation plans — — 2.8
Weighted average shares outstanding and dilutive potential
common shares 346.3 306.7 319.1
Earnings (loss) per common share
Basic[1] [2] $ (2.93) $ (8.99) $ 9.32
Diluted [2] $ (2.93) $ (8.99) $ 9.24
[1] Due to the net loss for the year ended December 31, 2008, no allocation of the net loss was made to the preferred shareholders under the two-class
method in the calculation of basic earnings per share, as the preferred shareholders had no contractual obligation to fund the net losses of the
Company. In the absence of the net loss, any such income would be allocated to the preferred shareholders based on the weighted average
number of preferred shares outstanding as of December 31, 2008.
[2] As a result of the net loss in the years ended December 31, 2009 and 2008, the Company used basic weighted average common shares outstanding
in the calculation of the year ended December 31, 2009 and 2008 diluted loss per share, since the inclusion of shares for warrants of 14.6 and 0,
respectively, stock compensation plans of 0.9 million and 1.3 million, respectively, and the assumed conversion of the preferred shares to common
of 0 and 5.0 million, respectively, would have been antidilutive to the earnings per share calculation. In the absence of the net loss, weighted
average common shares outstanding and dilutive potential common shares would have totaled 361.8 million and 313.0 million for the years ended
December 31, 2009 and 2008, respectively.
Basic earnings per share is computed based on the weighted average number of common shares outstanding during the year. Diluted
earnings per share include the dilutive effect of stock compensation plans, warrants, and assumed conversion of preferred shares to
common using the treasury stock method. Contingently issuable shares are included for the number of shares issuable assuming the end
of the reporting period was the end of the contingency period, if dilutive.
Under the treasury stock method for stock compensation plans, shares are assumed to be issued and then reduced for the number of
shares repurchaseable with theoretical proceeds at the average market price for the period. Theoretical proceeds for the stock
compensation plans include option exercise price payments, unamortized stock compensation expense and tax benefits realized in excess
of the tax benefit recognized in net income. The difference between the number of shares assumed issued and number of shares
purchased represents the dilutive shares. Upon exercise of outstanding options or vesting of other stock compensation plan awards, the
additional shares issued and outstanding are included in the calculation of the Company’ s weighted average shares from the date of
exercise or vesting.
Under the treasury stock method for the warrants issued to the U.S. Treasury in June of 2009, see Note 15, exercise shall be assumed at
the beginning of the period. The proceeds from exercise of $9.79 per share shall be assumed to be used to purchase common shares at
the average market price during the period.
Under the treasury stock method for the warrants issued to Allianz, see Note 21, exercise shall be assumed at the beginning of the
period. The proceeds from exercise of $25.25 in 2009 and $25.32 in 2008 per share shall be assumed to be used to purchase common
shares at the average market price during the period. Since the average market price of the common stock from the date of issuance of
the warrants to Allianz through December 31, 2008 did not exceed the exercise price of the warrants, there is no dilutive effect for the
warrants for the year ended December 31, 2008.