The Hartford 2009 Annual Report Download - page 80
Download and view the complete annual report
Please find page 80 of the 2009 The Hartford annual report below. You can navigate through the pages in the report by either clicking on the pages listed below, or by using the keyword search tool below to find specific information within the annual report.-
 1
1 -
2
-
3
-
4
-
5
-
6
-
7
-
8
-
9
-
10
-
11
-
12
-
13
-
14
-
15
-
16
-
17
-
18
-
19
-
20
-
21
-
22
-
23
-
24
-
25
-
26
-
27
-
28
-
29
-
30
-
31
-
32
-
33
-
34
-
35
-
36
-
37
-
38
-
39
-
40
-
41
-
42
-
43
-
44
-
45
-
46
-
47
-
48
-
49
-
50
-
51
-
52
-
53
-
54
-
55
-
56
-
57
-
58
-
59
-
60
-
61
-
62
-
63
-
64
-
65
-
66
-
67
-
68
-
69
-
 70
70 -
 71
71 -
 72
72 -
 73
73 -
 74
74 -
 75
75 -
 76
76 -
 77
77 -
 78
78 -
 79
79 -
 80
80 -
 81
81 -
 82
82 -
 83
83 -
 84
84 -
 85
85 -
 86
86 -
 87
87 -
 88
88 -
 89
89 -
 90
90 -
91
-
92
-
93
-
94
-
95
-
96
-
97
-
98
-
99
-
100
-
101
-
102
-
103
-
104
-
105
-
106
-
107
-
108
-
109
-
110
-
111
-
112
-
113
-
114
-
115
-
116
-
117
-
118
-
119
-
120
-
121
-
122
-
123
-
124
-
125
-
126
-
127
-
128
-
129
-
130
-
131
-
132
-
133
-
134
-
135
-
136
-
137
-
138
-
139
-
140
-
141
-
142
-
143
-
144
-
145
-
146
-
147
-
148
-
149
-
150
-
151
-
152
-
153
-
154
-
155
-
156
-
157
-
158
-
159
-
160
-
161
-
162
-
163
-
164
-
165
-
166
-
167
-
168
-
169
-
170
-
171
-
172
-
173
-
174
-
175
-
176
-
177
-
178
-
179
-
180
-
181
-
182
-
183
-
184
-
185
-
186
-
187
-
188
-
189
-
190
-
191
-
192
-
193
-
194
-
195
-
196
-
197
-
198
-
199
-
200
-
201
-
202
-
203
-
204
-
205
-
206
-
207
-
208
-
209
-
210
-
211
-
212
-
213
-
214
-
215
-
216
-
217
-
218
-
219
-
220
-
221
-
222
-
223
-
224
-
225
-
226
-
227
-
228
-
229
-
230
-
231
-
232
-
233
-
234
-
235
-
236
-
237
-
238
-
239
-
240
-
241
-
242
-
243
-
244
-
245
-
246
-
247
-
248
-
249
-
250
-
251
-
252
-
253
-
254
-
255
-
256
-
257
-
258
-
259
-
260
-
261
-
262
-
263
-
264
-
265
-
266
-
267
 |
 |

80
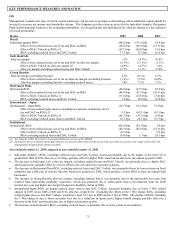
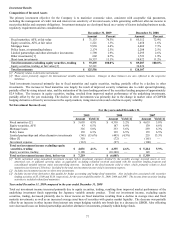
RETAIL
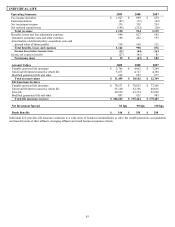
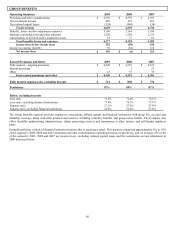
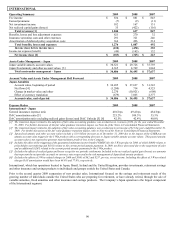
Operating Summary 2009 2008 2007
Fee income and other $ 2,139 $ 2,757 $ 3,117
Earned premiums (7) (4) (62)
Net investment income 750 747 801
Net realized capital losses (7) (1,910) (381)
Total revenues [1] 2,875 1,590 3,475
Benefits, losses and loss adjustment expenses 1,310 1,008 820
Insurance operating costs and other expenses 1,049 1,187 1,221
Amortization of deferred policy acquisition costs
and present value of future profits
1,389
1,344
406
Goodwill impairment — 422 —
Total benefits, losses and expenses 3,748 3,961 2,447
Income (loss) before income taxes (873) (2,371) 1,028
Income tax expense (benefit) (463) (972) 216
Net income (loss) [2] $ (410) $(1,399) $ 812
Assets Under Management
2009
2008
2007
Individual variable annuity account values $ 84,679 $ 74,578 $ 119,071
Individual fixed annuity and other account values 12,110 11,278 10,243
Other retail products account values — 398 677
Total account values [3] 96,789 86,254 129,991
Retail mutual fund assets under management 42,829 31,032 48,383
Other mutual fund assets under management 1,202 1,678 2,113
Total mutual fund assets under management 44,031 32,710 50,496
Total assets under management $ 140,820 $118,964 $ 180,487
Account Value and Assets Under Management Roll Forward
2009
2008
2007
Individual Variable Annuities
Account value, beginning of period $ 74,578 $ 119,071 $114,365
Net flows (7,122) (6,235) (2,733)
Change in market value and other 17,223 (38,258) 7,439
Account value, end of period $ 84,679 $74,578 $119,071
Retail Mutual Funds
Assets under management, beginning of period $ 31,032 $ 48,383 $38,536
Net sales 2,004 2,840 5,545
Change in market value and other 9,793 (20,191) 4,302
Assets under management, end of period $ 42,829 $31,032 $48,383
Net Investment Spread
2009
2008
2007
Individual Annuities
Individual Annuity 28 bps 73 bps 174 bps
Expense Ratios
2009
2008
2007
Individual Annuities
General insurance expense ratio 21.0 bps 21.0 bps 17.9 bps
DAC amortization ratio [4] 244.3% 218.5% 25.5%
DAC amortization ratio, excluding realized losses and DAC Unlocks [4] [5] 61.6% 65.2% 47.9%
[1] For the year ended December 31, 2008, the transition impact related to the adoption of fair value accounting guidance was a reduction in
revenues of $616. For further discussion of the fair value guidance transition impact, see Note 4a of the Notes to Consolidated Financial
Statements.
[2] For the year ended December 31, 2008, the transition impact related to the adoption of fair value accounting guidance was a reduction in net
income of $209. For further discussion of the fair value guidance transition impact, see Note 4a of the Notes to Consolidated Financial
Statements.
[3] Includes policyholders’ balances for investment contracts and reserves for future policy benefits for insurance contracts.
[4] Excludes the effects of realized gains and losses.
[5] See Unlock discussion.
Retail focuses on the savings and retirement needs of the growing number of individuals who are preparing for retirement, or have
already retired, through the sale of individual variable and fixed annuities, mutual funds and other investment products. Life is both a
writer of individual variable annuities and a seller of individual variable annuities through banks in the United States.