The Hartford 2009 Annual Report Download - page 13
Download and view the complete annual report
Please find page 13 of the 2009 The Hartford annual report below. You can navigate through the pages in the report by either clicking on the pages listed below, or by using the keyword search tool below to find specific information within the annual report. 13
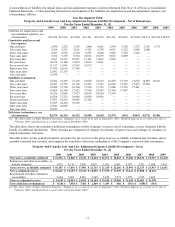
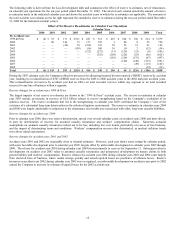
Reserve changes for accident years 2003 through 2008
Even after considering the 2007 calendar year reclassification of $347 of IBNR reserves from the 2003 to 2006 accident years to the
2002 and prior accident years, accident years 2003 through 2007 show favorable development in calendar years 2004 through 2009. A
portion of the release comes from short-tail lines of business, where results emerge quickly. During calendar year 2005 and 2006,
favorable re-estimates occurred in Personal Lines for both loss and allocated loss adjustment expenses. In addition, catastrophe reserves
related to the 2004 and 2005 hurricanes developed favorably in 2006. During calendar years 2005 through 2008, the Company
recognized favorable re-estimates of both loss and allocated loss adjustment expenses on workers’ compensation claims driven, in part,
by state legal reforms, including in California and Florida, underwriting actions and expense reduction initiatives that have had a greater
impact in controlling costs than was originally estimated. In 2007, the Company released reserves for Small Commercial package
business claims as reported losses have emerged favorably to previous expectations. In 2007 through 2009, the Company released
reserves for Middle Market general liability claims due to the favorable emergence of losses for high hazard and umbrella general
liability claims. Reserves for professional liability claims were released in 2008 and 2009 related to the 2003 through 2007 accident
years due to a lower estimate of claim severity on both directors’ and officers’ insurance claims and errors and omissions insurance
claims. Reserves of Personal Lines auto liability claims were released in 2008 due largely to an improvement in emerged claim severity
for the 2005 to 2007 accident years.
Ceded Reinsurance
The Hartford cedes insurance risk to reinsurance companies. Reinsurance does not relieve The Hartford of its primary liability and, as
such, failure of reinsurers to honor their obligations could result in losses to The Hartford. The Hartford evaluates the risk transfer of its
reinsurance contracts, the financial condition of its reinsurers and monitors concentrations of credit risk. The Company’ s monitoring
procedures include careful initial selection of its reinsurers, structuring agreements to provide collateral funds where possible, and
regularly monitoring the financial condition and ratings of its reinsurers. Reinsurance accounting is followed for ceded transactions that
provide indemnification against loss or liability relating to insurance risk (i.e., risk transfer). For further discussion, see Note 6 of Notes
to Consolidated Financial Statements. If the ceded transactions do not provide risk transfer, the Company accounts for these
transactions as financing transactions.
For Property & Casualty operations, these reinsurance arrangements are intended to provide greater diversification of business and limit
The Hartford’ s maximum net loss arising from large risks or catastrophes. A major portion of The Hartford’ s property and casualty
reinsurance is effected under general reinsurance contracts known as treaties, or, in some instances, is negotiated on an individual risk
basis, known as facultative reinsurance. The Hartford also has in-force excess of loss contracts with reinsurers that protect it against a
specified part or all of a layer of losses over stipulated amounts.
In accordance with normal industry practice, Life is involved in both the cession and assumption of insurance with other insurance and
reinsurance companies. As of December 31, 2009 and 2008, the Company's policy for the largest amount of life insurance retained on
any one life by the life operations was $10. In addition, Life has reinsured U.S. minimum death benefit guarantees, Japan’ s guaranteed
minimum death and income benefits, as well as U.S. guaranteed minimum withdrawal benefits offered in connection with its variable
annuity contracts. Reinsurance of the Company’ s GMWB riders meet the definition of a derivative reported at fair value: under fair
value the change in fair value of the reinsurance derivative is reported in earnings. Life also assumes reinsurance from other insurers.
For the years ended December 31, 2009, 2008 and 2007, Life did not make any significant changes in the terms under which reinsurance
is ceded to other insurers. For further discussion on reinsurance, see Part II, Item 7, MD&A – Capital Markets Risk Management –
Reinsurance.
Investment Operations
The Company’ s investment portfolios are primarily divided between Life and Property & Casualty and are managed by Hartford
Investment Management Company (“HIMCO”). HIMCO manages the portfolios to maximize economic value, while attempting to
generate the income necessary to support the Company’ s various product obligations, within internally established objectives, guidelines
and risk tolerances. The portfolio objectives and guidelines are developed based upon the asset/liability profile, including duration,
convexity and other characteristics within specified risk tolerances. The risk tolerances considered include, for example, asset and credit
issuer allocation limits, maximum portfolio below investment grade holdings and foreign currency exposure. The Company attempts to
minimize adverse impacts to the portfolio and the Company’ s results of operations from changes in economic conditions through asset
allocation limits, asset/liability duration matching and through the use of derivatives. For further discussion of HIMCO’ s portfolio
management approach, see Part II, Item 7, MD&A – Investment Credit Risk.
In addition to managing the general account assets of the Company, HIMCO is also an SEC registered investment advisor for third-party
institutional clients, a sub-advisor for certain mutual funds and serves as the sponsor and collateral manager for capital markets
transactions. HIMCO specializes in investment management that incorporates proprietary research and active management within a
disciplined risk framework to provide value added returns versus peers and benchmarks. As of December 31, 2009 and 2008, the fair
value of HIMCO’ s total assets under management was approximately $144.0 billion and $138.8 billion, respectively, of which $8.1
billion and $7.7 billion, respectively, were held in HIMCO managed third party accounts.


