The Hartford 2009 Annual Report Download - page 137
Download and view the complete annual report
Please find page 137 of the 2009 The Hartford annual report below. You can navigate through the pages in the report by either clicking on the pages listed below, or by using the keyword search tool below to find specific information within the annual report.-
 1
1 -
2
-
3
-
4
-
5
-
6
-
7
-
8
-
9
-
10
-
11
-
12
-
13
-
14
-
15
-
16
-
17
-
18
-
19
-
20
-
21
-
22
-
23
-
24
-
25
-
26
-
27
-
28
-
29
-
30
-
31
-
32
-
33
-
34
-
35
-
36
-
37
-
38
-
39
-
40
-
41
-
42
-
43
-
44
-
45
-
46
-
47
-
48
-
49
-
50
-
51
-
52
-
53
-
54
-
55
-
56
-
57
-
58
-
59
-
60
-
61
-
62
-
63
-
64
-
65
-
66
-
67
-
68
-
69
-
70
-
71
-
72
-
73
-
74
-
75
-
76
-
77
-
78
-
79
-
80
-
81
-
82
-
83
-
84
-
85
-
86
-
87
-
88
-
89
-
90
-
91
-
92
-
93
-
94
-
95
-
96
-
97
-
98
-
99
-
100
-
101
-
102
-
103
-
104
-
105
-
106
-
107
-
108
-
109
-
110
-
111
-
112
-
113
-
114
-
115
-
116
-
117
-
118
-
119
-
120
-
121
-
122
-
123
-
124
-
125
-
126
-
 127
127 -
 128
128 -
 129
129 -
 130
130 -
 131
131 -
 132
132 -
 133
133 -
 134
134 -
 135
135 -
 136
136 -
 137
137 -
 138
138 -
 139
139 -
 140
140 -
 141
141 -
 142
142 -
 143
143 -
 144
144 -
 145
145 -
 146
146 -
 147
147 -
148
-
149
-
150
-
151
-
152
-
153
-
154
-
155
-
156
-
157
-
158
-
159
-
160
-
161
-
162
-
163
-
164
-
165
-
166
-
167
-
168
-
169
-
170
-
171
-
172
-
173
-
174
-
175
-
176
-
177
-
178
-
179
-
180
-
181
-
182
-
183
-
184
-
185
-
186
-
187
-
188
-
189
-
190
-
191
-
192
-
193
-
194
-
195
-
196
-
197
-
198
-
199
-
200
-
201
-
202
-
203
-
204
-
205
-
206
-
207
-
208
-
209
-
210
-
211
-
212
-
213
-
214
-
215
-
216
-
217
-
218
-
219
-
220
-
221
-
222
-
223
-
224
-
225
-
226
-
227
-
228
-
229
-
230
-
231
-
232
-
233
-
234
-
235
-
236
-
237
-
238
-
239
-
240
-
241
-
242
-
243
-
244
-
245
-
246
-
247
-
248
-
249
-
250
-
251
-
252
-
253
-
254
-
255
-
256
-
257
-
258
-
259
-
260
-
261
-
262
-
263
-
264
-
265
-
266
-
267
 |
 |

137
Insurance Operations
Current and expected patterns of claim frequency and severity or surrenders may change from period to period but continue to be within
historical norms and, therefore, the Company’ s insurance operations’ current liquidity position is considered to be sufficient to meet
anticipated demands over the next twelve months, including any obligations related to the Company’ s restructuring activities. For a
discussion and tabular presentation of the Company’ s current contractual obligations by period, refer to Off-Balance Sheet
Arrangements and Aggregate Contractual Obligations within the Capital Resources and Liquidity section of the MD&A.
The principal sources of operating funds are premiums, fees earned from assets under management and investment income, while
investing cash flows originate from maturities and sales of invested assets. The primary uses of funds are to pay claims, claim
adjustment expenses, commissions and other underwriting expenses, to purchase new investments and to make dividend payments to the
HFSG Holding Company.
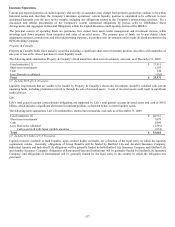
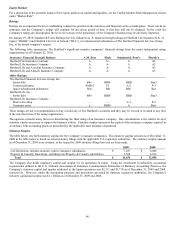
Property & Casualty
Property & Casualty holds fixed maturity securities including a significant short-term investment position (securities with maturities of
one year or less at the time of purchase) to meet liquidity needs.
The following table summarizes Property & Casualty’ s fixed maturities, short-term investments, and cash, as of December 31, 2009:
Fixed maturities [1] $ 23,911
Short-term investments 1,283
Cash 240
Less: Derivative collateral (103)
Total $ 25,331
[1] Includes $829 of U.S. Treasuries.
Liquidity requirements that are unable to be funded by Property & Casualty’ s short-term investments would be satisfied with current
operating funds, including premiums received or through the sale of invested assets. A sale of invested assets could result in significant
realized losses.
Life
Life’ s total general account contractholder obligations are supported by Life’ s total general account invested assets and cash of $65.0
billion, which includes a significant short-term investment position, as depicted below, to meet liquidity needs.
The following table summarizes Life’ s fixed maturities, short-term investments, and cash, as of December 31, 2009:
Fixed maturities [1] $ 46,912
Short-term investments 7,079
Cash 1,898
Less: Derivative collateral (1,591)
Cash associated with Japan variable annuities (634)
Total $ 53,664
[1] Includes $2.6 billion of U.S. Treasuries.
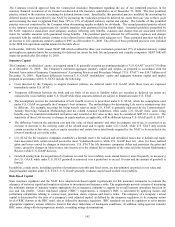
Capital resources available to fund liquidity, upon contract holder surrender, are a function of the legal entity in which the liquidity
requirement resides. Generally, obligations of Group Benefits will be funded by Hartford Life and Accident Insurance Company;
Individual Annuity and Individual Life obligations will be generally funded by both Hartford Life Insurance Company and Hartford Life
and Annuity Insurance Company; obligations of Retirement Plans and Institutional will be generally funded by Hartford Life Insurance
Company; and obligations of International will be generally funded by the legal entity in the country in which the obligation was
generated.