The Hartford 2009 Annual Report Download - page 97
Download and view the complete annual report
Please find page 97 of the 2009 The Hartford annual report below. You can navigate through the pages in the report by either clicking on the pages listed below, or by using the keyword search tool below to find specific information within the annual report.-
 1
1 -
2
-
3
-
4
-
5
-
6
-
7
-
8
-
9
-
10
-
11
-
12
-
13
-
14
-
15
-
16
-
17
-
18
-
19
-
20
-
21
-
22
-
23
-
24
-
25
-
26
-
27
-
28
-
29
-
30
-
31
-
32
-
33
-
34
-
35
-
36
-
37
-
38
-
39
-
40
-
41
-
42
-
43
-
44
-
45
-
46
-
47
-
48
-
49
-
50
-
51
-
52
-
53
-
54
-
55
-
56
-
57
-
58
-
59
-
60
-
61
-
62
-
63
-
64
-
65
-
66
-
67
-
68
-
69
-
70
-
71
-
72
-
73
-
74
-
75
-
76
-
77
-
78
-
79
-
80
-
81
-
82
-
83
-
84
-
85
-
86
-
 87
87 -
 88
88 -
 89
89 -
 90
90 -
 91
91 -
 92
92 -
 93
93 -
 94
94 -
 95
95 -
 96
96 -
 97
97 -
 98
98 -
 99
99 -
 100
100 -
 101
101 -
 102
102 -
 103
103 -
 104
104 -
 105
105 -
 106
106 -
 107
107 -
108
-
109
-
110
-
111
-
112
-
113
-
114
-
115
-
116
-
117
-
118
-
119
-
120
-
121
-
122
-
123
-
124
-
125
-
126
-
127
-
128
-
129
-
130
-
131
-
132
-
133
-
134
-
135
-
136
-
137
-
138
-
139
-
140
-
141
-
142
-
143
-
144
-
145
-
146
-
147
-
148
-
149
-
150
-
151
-
152
-
153
-
154
-
155
-
156
-
157
-
158
-
159
-
160
-
161
-
162
-
163
-
164
-
165
-
166
-
167
-
168
-
169
-
170
-
171
-
172
-
173
-
174
-
175
-
176
-
177
-
178
-
179
-
180
-
181
-
182
-
183
-
184
-
185
-
186
-
187
-
188
-
189
-
190
-
191
-
192
-
193
-
194
-
195
-
196
-
197
-
198
-
199
-
200
-
201
-
202
-
203
-
204
-
205
-
206
-
207
-
208
-
209
-
210
-
211
-
212
-
213
-
214
-
215
-
216
-
217
-
218
-
219
-
220
-
221
-
222
-
223
-
224
-
225
-
226
-
227
-
228
-
229
-
230
-
231
-
232
-
233
-
234
-
235
-
236
-
237
-
238
-
239
-
240
-
241
-
242
-
243
-
244
-
245
-
246
-
247
-
248
-
249
-
250
-
251
-
252
-
253
-
254
-
255
-
256
-
257
-
258
-
259
-
260
-
261
-
262
-
263
-
264
-
265
-
266
-
267
 |
 |

97
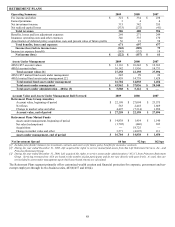
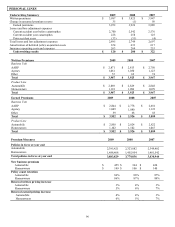
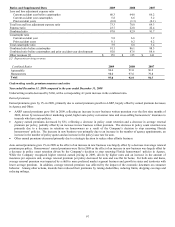
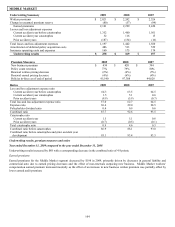
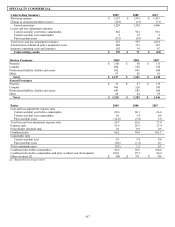
Ratios and Supplemental Data 2009 2008 2007
Loss and loss adjustment expense ratio
Current accident year before catastrophes 68.3 64.8 66.2
Current accident year catastrophes 5.8 6.6 3.2
Prior accident years (0.8) (1.3) (0.1)
Total loss and loss adjustment expense ratio 73.3 70.0 69.3
Expense ratio 23.7 22.8 22.4
Combined ratio 97.0 92.9 91.7
Catastrophe ratio
Current accident year 5.8 6.6 3.2
Prior accident years 0.1 0.2 0.2
Total catastrophe ratio 5.9 6.8 3.4
Combined ratio before catastrophes 91.1 86.1 88.3
Combined ratio before catastrophes and prior accident year development 92.0 87.6 88.6
Other revenues [1] $ 153 $ 135 $ 141
[1] Represents servicing revenues.
Combined Ratios
2009
2008
2007
Automobile 96.6 91.0 96.2
Homeowners 98.0 97.6 79.8
Total 97.0 92.9 91.7
Underwriting results, premium measures and ratios
Year ended December 31, 2009 compared to the year ended December 31, 2008
Underwriting results decreased by $160, with a corresponding 4.1 point increase in the combined ratio.
Earned premiums
Earned premiums grew by 1% in 2009, primarily due to earned premium growth in AARP, largely offset by earned premium decreases
in Agency and Other.
• AARP earned premiums grew $66 in 2009, reflecting an increase in new business written premium over the first nine months of
2009, driven by increased direct marketing spend, higher auto policy conversion rates and cross-selling homeowners’ insurance to
insureds who have auto policies.
• Agency earned premiums decreased by $31, reflecting a decrease in policy count retention and a decrease in average renewal
premium per policy, partially offset by an increase in new business written premium. The decrease in policy count retention was
primarily due to a decrease in retention on homeowners as a result of the Company’ s decision to stop renewing Florida
homeowners’ policies. The increase in new business was primarily due to an increase in the number of agency appointments, an
increase in the number of policy quotes and an increase in the policy issue rate for auto.
• Other earned premiums decreased primarily due to a strategic decision to reduce other affinity business.
Auto earned premiums grew 1% in 2009 as the effect of an increase in new business was largely offset by a decrease in average renewal
premium per policy. Homeowners’ earned premiums were flat in 2009 as the effect of an increase in new business was largely offset by
a decrease in policy count retention driven by the Company’ s decision to stop renewing Florida homeowners’ policies in Agency.
While the Company recognized higher renewal earned pricing in 2009, driven by higher rates and an increase in the amount of
insurance per exposure unit, average renewal premium per policy decreased for auto and was flat for home. For both auto and home,
average renewal premium was impacted by a shift to more preferred market segment business and growth in states and territories with
lower average premium. In addition, average renewal premium was affected by the impact of the economic downturn on consumer
behavior. Among other actions, insureds have reduced their premiums by raising deductibles, reducing limits, dropping coverage and
reducing mileage.