The Hartford 2009 Annual Report Download - page 110
Download and view the complete annual report
Please find page 110 of the 2009 The Hartford annual report below. You can navigate through the pages in the report by either clicking on the pages listed below, or by using the keyword search tool below to find specific information within the annual report.-
 1
1 -
2
-
3
-
4
-
5
-
6
-
7
-
8
-
9
-
10
-
11
-
12
-
13
-
14
-
15
-
16
-
17
-
18
-
19
-
20
-
21
-
22
-
23
-
24
-
25
-
26
-
27
-
28
-
29
-
30
-
31
-
32
-
33
-
34
-
35
-
36
-
37
-
38
-
39
-
40
-
41
-
42
-
43
-
44
-
45
-
46
-
47
-
48
-
49
-
50
-
51
-
52
-
53
-
54
-
55
-
56
-
57
-
58
-
59
-
60
-
61
-
62
-
63
-
64
-
65
-
66
-
67
-
68
-
69
-
70
-
71
-
72
-
73
-
74
-
75
-
76
-
77
-
78
-
79
-
80
-
81
-
82
-
83
-
84
-
85
-
86
-
87
-
88
-
89
-
90
-
91
-
92
-
93
-
94
-
95
-
96
-
97
-
98
-
99
-
 100
100 -
 101
101 -
 102
102 -
 103
103 -
 104
104 -
 105
105 -
 106
106 -
 107
107 -
 108
108 -
 109
109 -
 110
110 -
 111
111 -
 112
112 -
 113
113 -
 114
114 -
 115
115 -
 116
116 -
 117
117 -
 118
118 -
 119
119 -
 120
120 -
121
-
122
-
123
-
124
-
125
-
126
-
127
-
128
-
129
-
130
-
131
-
132
-
133
-
134
-
135
-
136
-
137
-
138
-
139
-
140
-
141
-
142
-
143
-
144
-
145
-
146
-
147
-
148
-
149
-
150
-
151
-
152
-
153
-
154
-
155
-
156
-
157
-
158
-
159
-
160
-
161
-
162
-
163
-
164
-
165
-
166
-
167
-
168
-
169
-
170
-
171
-
172
-
173
-
174
-
175
-
176
-
177
-
178
-
179
-
180
-
181
-
182
-
183
-
184
-
185
-
186
-
187
-
188
-
189
-
190
-
191
-
192
-
193
-
194
-
195
-
196
-
197
-
198
-
199
-
200
-
201
-
202
-
203
-
204
-
205
-
206
-
207
-
208
-
209
-
210
-
211
-
212
-
213
-
214
-
215
-
216
-
217
-
218
-
219
-
220
-
221
-
222
-
223
-
224
-
225
-
226
-
227
-
228
-
229
-
230
-
231
-
232
-
233
-
234
-
235
-
236
-
237
-
238
-
239
-
240
-
241
-
242
-
243
-
244
-
245
-
246
-
247
-
248
-
249
-
250
-
251
-
252
-
253
-
254
-
255
-
256
-
257
-
258
-
259
-
260
-
261
-
262
-
263
-
264
-
265
-
266
-
267
 |
 |

110
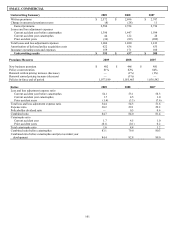
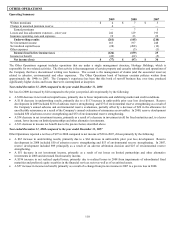
OTHER OPERATIONS
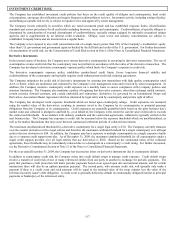
Operating Summary
2009 2008 2007
Written premiums $4 $ 7 $ 5
Change in unearned premium reserve 4 — —
Earned premiums — 7 5
Losses and loss adjustment expenses – prior year 242 129 193
Insurance operating costs and expenses 19 23 22
Underwriting results (261) (145) (210)
Net investment income 163 197 248
Net realized capital losses (28) (208) (12)
Other expenses — (3) (1)
Income (loss) before income taxes (126) (159) 25
Income tax benefit (49) (62) (5)
Net income (loss) $(77) $ (97) $ 30
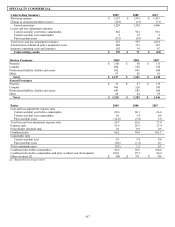
The Other Operations segment includes operations that are under a single management structure, Heritage Holdings, which is
responsible for two related activities. The first activity is the management of certain property and casualty subsidiaries and operations of
the Company that have discontinued writing new business. The second is the management of claims (and the associated reserves)
related to asbestos, environmental and other exposures. The Other Operations book of business contains policies written from
approximately the 1940s to 2003. The Company’ s experience has been that this book of run-off business has, over time, produced
significantly higher claims and losses than were contemplated at inception.
Year ended December 31, 2009 compared to the year ended December 31, 2008
Net loss for 2009 decreased by $20 compared to the prior year period, driven primarily by the following:
• A $180 decrease in net realized capital losses, primarily due to fewer impairments and stabilizing market and credit conditions.
• A $116 decrease in underwriting results, primarily due to a $113 increase in unfavorable prior year loss development. Reserve
development in 2009 included $138 of asbestos reserve strengthening and $75 of environmental reserve strengthening as a result of
the Company’ s annual asbestos and environmental reserve evaluations, partially offset by a decrease of $20 in the allowance for
uncollectible reinsurance as a result of the Company’ s annual evaluation of reinsurance recoverables. In 2008, reserve development
included $50 of asbestos reserve strengthening and $53 of environmental reserve strengthening.
• A $34 decrease in net investment income, primarily as a result of a decrease in investment yield for fixed maturities and, to a lesser
extent, lower income on limited partnerships and other alternative investments.
• A $13 decrease in income tax benefit due to the pre-tax factors described above.
Year ended December 31, 2008 compared to the year ended December 31, 2007
Other Operations reported a net loss of $97 in 2008 compared to net income of $30 in 2007, driven primarily by the following:
• A $65 increase in underwriting results, primarily due to a $64 decrease in unfavorable prior year loss development. Reserve
development in 2008 included $50 of asbestos reserve strengthening and $53 of environmental reserve strengthening. In 2007,
reserve development included $99 principally as a result of an adverse arbitration decision and $25 of environmental reserve
strengthening.
• A $51 decrease in net investment income, primarily as a result of net losses on limited partnerships and other alternative
investments in 2008 and decreased fixed maturity income.
• A $196 increase in net realized capital losses, primarily due to realized losses in 2008 from impairments of subordinated fixed
maturities and preferred equity securities in the financial services sector as well as of securitized assets.
• A $57 increase in income tax benefit, primarily as a result of a change from pre-tax income in 2007 to a pre-tax loss in 2008.