Xcel Energy 2010 Annual Report Download - page 95
Download and view the complete annual report
Please find page 95 of the 2010 Xcel Energy annual report below. You can navigate through the pages in the report by either clicking on the pages listed below, or by using the keyword search tool below to find specific information within the annual report.-
 1
1 -
2
-
3
-
4
-
5
-
6
-
7
-
8
-
9
-
10
-
11
-
12
-
13
-
14
-
15
-
16
-
17
-
18
-
19
-
20
-
21
-
22
-
23
-
24
-
25
-
26
-
27
-
28
-
29
-
30
-
31
-
32
-
33
-
34
-
35
-
36
-
37
-
38
-
39
-
40
-
41
-
42
-
43
-
44
-
45
-
46
-
47
-
48
-
49
-
50
-
51
-
52
-
53
-
54
-
55
-
56
-
57
-
58
-
59
-
60
-
61
-
62
-
63
-
64
-
65
-
66
-
67
-
68
-
69
-
70
-
71
-
72
-
73
-
74
-
75
-
76
-
77
-
78
-
79
-
80
-
81
-
82
-
83
-
84
-
 85
85 -
 86
86 -
 87
87 -
 88
88 -
 89
89 -
 90
90 -
 91
91 -
 92
92 -
 93
93 -
 94
94 -
 95
95 -
 96
96 -
 97
97 -
 98
98 -
 99
99 -
 100
100 -
 101
101 -
 102
102 -
 103
103 -
 104
104 -
 105
105 -
106
-
107
-
108
-
109
-
110
-
111
-
112
-
113
-
114
-
115
-
116
-
117
-
118
-
119
-
120
-
121
-
122
-
123
-
124
-
125
-
126
-
127
-
128
-
129
-
130
-
131
-
132
-
133
-
134
-
135
-
136
-
137
-
138
-
139
-
140
-
141
-
142
-
143
-
144
-
145
-
146
-
147
-
148
-
149
-
150
-
151
-
152
-
153
-
154
-
155
-
156
-
157
-
158
-
159
-
160
-
161
-
162
-
163
-
164
-
165
-
166
-
167
-
168
-
169
-
170
-
171
-
172
 |
 |

85
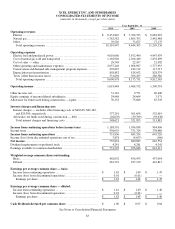
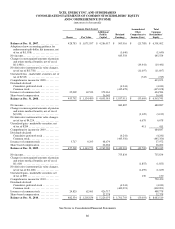
XCEL ENERGY INC. AND SUBSIDIARIES
CONSOLIDATED BALANCE SHEETS
(amounts in thousands of dollars)
Dec. 31
2010 2009
Assets
Current assets
Cash and cash equivalents ............................................................. $ 108,437 $ 115,648
Accounts receivable, net ............................................................... 718,474 730,152
Accrued unbilled revenues ............................................................. 708,691 694,049
Inventories .......................................................................... 560,800 566,205
Regulatory assets ..................................................................... 388,541 357,011
Derivative instruments ................................................................ 54,079 97,700
Deferred income taxes ................................................................
—
223,079
Prepayments and other ................................................................ 193,621 192,791
Total current assets ................................................................. 2,732,643 2,976,635
Property, plant and equipment, net ........................................................ 20,663,082 18,508,296
Other assets
Nuclear decommissioning fund and other investments ...................................... 1,476,435 1,381,835
Regulatory assets ..................................................................... 2,151,460 1,987,369
Derivative instruments ................................................................ 184,026 289,530
Other .............................................................................. 180,044 162,296
Total other assets ................................................................... 3,991,965 3,821,030
Total assets ..................................................................... $ 27,387,690 $ 25,305,961
Liabilities and Equity
Current liabilities
Current portion of long-term debt ....................................................... $ 55,415 $ 543,814
Short-term debt ...................................................................... 466,400 459,000
Accounts payable .................................................................... 979,750 1,083,572
Regulatory liabilities .................................................................. 156,038 199,154
Taxes accrued ....................................................................... 254,320 257,739
Accrued interest ..................................................................... 163,907 159,686
Dividends payable .................................................................... 122,847 113,147
Derivative instruments ................................................................ 61,745 46,554
Other .............................................................................. 276,111 227,333
Total current liabilities .............................................................. 2,536,533 3,089,999
Deferred credits and other liabilities
Deferred income taxes ................................................................ 3,390,027 3,156,369
Deferred investment tax credits ......................................................... 92,937 99,290
Regulatory liabilities .................................................................. 1,179,765 1,148,014
Asset retirement obligations ............................................................ 969,310 881,479
Derivative instruments ................................................................ 285,986 307,770
Customer advances ................................................................... 269,087 295,470
Pension and employee benefit obligations ................................................ 962,767 839,051
Other .............................................................................. 249,635 211,666
Total deferred credits and other liabilities ............................................... 7,399,514 6,939,109
Commitments and contingent liabilities
Capitalization
Long-term debt ...................................................................... 9,263,144 7,888,628
Preferred stockholders’ equity .......................................................... 104,980 104,980
Common stock — $2.50 par value per share .............................................. 1,205,834 1,143,773
Additional paid in capital .............................................................. 5,229,075 4,769,980
Retained earnings .................................................................... 1,701,703 1,419,201
Accumulated other comprehensive loss .................................................. (53,093) (49,709)
Total common stockholders’ equity ................................................... 8,083,519 7,283,245
Total liabilities and equity ......................................................... $ 27,387,690 $ 25,305,961
See Notes to Consolidated Financial Statements