Xcel Energy 2010 Annual Report Download - page 94
Download and view the complete annual report
Please find page 94 of the 2010 Xcel Energy annual report below. You can navigate through the pages in the report by either clicking on the pages listed below, or by using the keyword search tool below to find specific information within the annual report.-
 1
1 -
2
-
3
-
4
-
5
-
6
-
7
-
8
-
9
-
10
-
11
-
12
-
13
-
14
-
15
-
16
-
17
-
18
-
19
-
20
-
21
-
22
-
23
-
24
-
25
-
26
-
27
-
28
-
29
-
30
-
31
-
32
-
33
-
34
-
35
-
36
-
37
-
38
-
39
-
40
-
41
-
42
-
43
-
44
-
45
-
46
-
47
-
48
-
49
-
50
-
51
-
52
-
53
-
54
-
55
-
56
-
57
-
58
-
59
-
60
-
61
-
62
-
63
-
64
-
65
-
66
-
67
-
68
-
69
-
70
-
71
-
72
-
73
-
74
-
75
-
76
-
77
-
78
-
79
-
80
-
81
-
82
-
83
-
 84
84 -
 85
85 -
 86
86 -
 87
87 -
 88
88 -
 89
89 -
 90
90 -
 91
91 -
 92
92 -
 93
93 -
 94
94 -
 95
95 -
 96
96 -
 97
97 -
 98
98 -
 99
99 -
 100
100 -
 101
101 -
 102
102 -
 103
103 -
 104
104 -
105
-
106
-
107
-
108
-
109
-
110
-
111
-
112
-
113
-
114
-
115
-
116
-
117
-
118
-
119
-
120
-
121
-
122
-
123
-
124
-
125
-
126
-
127
-
128
-
129
-
130
-
131
-
132
-
133
-
134
-
135
-
136
-
137
-
138
-
139
-
140
-
141
-
142
-
143
-
144
-
145
-
146
-
147
-
148
-
149
-
150
-
151
-
152
-
153
-
154
-
155
-
156
-
157
-
158
-
159
-
160
-
161
-
162
-
163
-
164
-
165
-
166
-
167
-
168
-
169
-
170
-
171
-
172
 |
 |

84
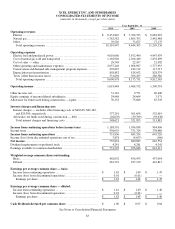
XCEL ENERGY INC. AND SUBSIDIARIES
CONSOLIDATED STATEMENTS OF CASH FLOWS
(amounts in thousands of dollars)
Year Ended Dec. 31
2010 2009 2008
Operating activities
Net income ............................................................... $ 755,834 $ 680,887 $ 645,554
Remove (income) loss from discontinued operations ............................... (3,878) 4,637 166
Adjustments to reconcile net income to cash provided by operating activities:
Depreciation and amortization ............................................... 872,186 835,597 843,461
Conservation and demand side management program amortization................... 21,700 29,418 39,931
Nuclear fuel amortization ................................................... 105,369 80,104 64,203
Deferred income taxes ..................................................... 414,460 407,517 281,802
Amortization of investment tax credits......................................... (6,353) (6,426) (7,198)
Allowance for equity funds used during construction .............................. (56,152) (75,686) (63,519)
Equity earnings of unconsolidated subsidiaries .................................. (29,948) (24,664) (3,571)
Dividends from unconsolidated subsidiaries ..................................... 32,538 29,059
—
Provision for bad debts ..................................................... 44,068 49,023 63,407
Share-based compensation expense ........................................... 35,807 29,672 25,511
Net realized and unrealized hedging and derivative transactions ..................... (35,552) 39,029 (31,895)
Changes in operating assets and liabilities:
Accounts receivable ..................................................... (29,749) 122,503 (13,405)
Accrued unbilled revenues ................................................ (14,642) 49,430 (11,520)
Inventories ............................................................ 9,239 100,504 (135,099)
Other current assets ...................................................... 10,461 (84,783) 9,181
Accounts payable ....................................................... (188,855) (50,638) 27,463
Net regulatory assets and liabilities .......................................... 36,096 (38,403) (136,807)
Other current liabilities ................................................... 13,192 49,388 140,264
Pension and other employee benefit obligations ................................ (62,625) (245,987) (105,113)
Change in other noncurrent assets............................................. 5,936 (1,991) 48,283
Change in other noncurrent liabilities .......................................... (35,190) (65,284) 6,507
N
et cash provided by operating activities ......................................... 1,893,942 1,912,906 1,687,606
Investing activities
Utility capital/construction expenditures ....................................... (2,217,327) (1,786,902) (2,113,655)
Allowance for equity funds used during construction .............................. 56,152 75,686 63,519
Purchase of investments in external decommissioning fund ......................... (3,781,438) (1,644,278) (957,752)
Proceeds from the sale of investments in external decommissioning fund .............. 3,786,373 1,664,957 914,514
Proceeds from the sale of assets .............................................. 87,823
—
—
Acquisition of generation assets .............................................. (732,495)
—
—
Investment in WYCO Development LLC ....................................... (8,046) (42,490) (97,924)
Change in restricted cash ................................................... 89 264 32,008
Other investments ......................................................... 2,145 (1,917) 2,589
N
et cash used in investing activities ............................................. (2,806,724) (1,734,680) (2,156,701)
Financing activities
Proceeds from (repayment of) short-term borrowings, net .......................... 7,400 3,750 (633,310)
Proceeds from issuance of long-term debt ...................................... 1,433,406 689,915 1,915,060
Repayment of long-term debt, including reacquisition premiums..................... (560,383) (621,296) (581,313)
Proceeds from issuance of common stock ...................................... 457,258 20,133 352,871
Dividends paid ........................................................... (432,110) (414,922) (382,282)
N
et cash provided by (used in) financing activities ................................. 905,571 (322,420) 671,026
N
et increase (decrease) in cash and cash equivalents ................................ (7,211) (144,194) 201,931
Cash and cash equivalents at beginning of period ................................... 115,648 259,842 57,911
Cash and cash equivalents at end of period........................................ $ 108,437 $ 115,648 $ 259,842
Supplemental disclosure of cash flow information:
Cash paid for interest (net of amounts capitalized) ............................... $ (530,072) $ (514,675) $ (485,373)
Cash received (paid) for income taxes, net ...................................... (16,635) 21,154 (94,744)
Supplemental disclosure of non-cash investing transactions:
Property, plant and equipment additions in accounts payable........................ $ 174,903 $ 68,417 $ 55,715
Storage assets under capital lease ............................................. 6,314 71,553
—
Supplemental disclosure of non-cash financing transactions:
Issuance of common stock for reinvested dividends and 401(k) plans ................. $ 63,905 $ 54,638 $ 56,009
Issuance of common stock for senior convertible notes ............................
—
—
57,500
See Notes to Consolidated Financial Statements