Xcel Energy 2010 Annual Report Download - page 106
Download and view the complete annual report
Please find page 106 of the 2010 Xcel Energy annual report below. You can navigate through the pages in the report by either clicking on the pages listed below, or by using the keyword search tool below to find specific information within the annual report.-
 1
1 -
2
-
3
-
4
-
5
-
6
-
7
-
8
-
9
-
10
-
11
-
12
-
13
-
14
-
15
-
16
-
17
-
18
-
19
-
20
-
21
-
22
-
23
-
24
-
25
-
26
-
27
-
28
-
29
-
30
-
31
-
32
-
33
-
34
-
35
-
36
-
37
-
38
-
39
-
40
-
41
-
42
-
43
-
44
-
45
-
46
-
47
-
48
-
49
-
50
-
51
-
52
-
53
-
54
-
55
-
56
-
57
-
58
-
59
-
60
-
61
-
62
-
63
-
64
-
65
-
66
-
67
-
68
-
69
-
70
-
71
-
72
-
73
-
74
-
75
-
76
-
77
-
78
-
79
-
80
-
81
-
82
-
83
-
84
-
85
-
86
-
87
-
88
-
89
-
90
-
91
-
92
-
93
-
94
-
95
-
 96
96 -
 97
97 -
 98
98 -
 99
99 -
 100
100 -
 101
101 -
 102
102 -
 103
103 -
 104
104 -
 105
105 -
 106
106 -
 107
107 -
 108
108 -
 109
109 -
 110
110 -
 111
111 -
 112
112 -
 113
113 -
 114
114 -
 115
115 -
 116
116 -
117
-
118
-
119
-
120
-
121
-
122
-
123
-
124
-
125
-
126
-
127
-
128
-
129
-
130
-
131
-
132
-
133
-
134
-
135
-
136
-
137
-
138
-
139
-
140
-
141
-
142
-
143
-
144
-
145
-
146
-
147
-
148
-
149
-
150
-
151
-
152
-
153
-
154
-
155
-
156
-
157
-
158
-
159
-
160
-
161
-
162
-
163
-
164
-
165
-
166
-
167
-
168
-
169
-
170
-
171
-
172
 |
 |

96
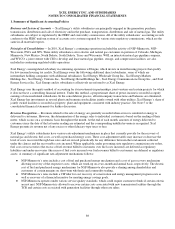
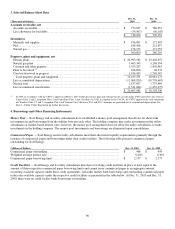
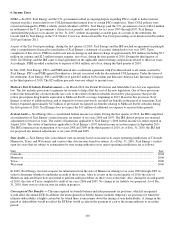
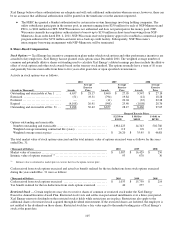
3. Selected Balance Sheet Data
(Thousands of Dollars) Dec. 31,
2010
Dec. 31,
2009
Accounts receivable, net
Accounts receivable ................................................................ $ 773,037 $ 786,255
Less allowance for bad debts ........................................................ (54,563) (56,103)
$ 718,474 $ 730,152
Inventories
Materials and supplies .............................................................. $ 196,081 $ 172,993
Fuel ............................................................................... 188,566 221,457
Natural gas ......................................................................... 176,153 171,755
$ 560,800 $ 566,205
Property, plant and equipment, net
Electric plant ....................................................................... $ 24,993,582 $ 22,402,657
Natural gas plant ................................................................... 3,463,343 3,269,934
Common and other property ......................................................... 1,555,287 1,492,463
Plant to be retired (a) ............................................................... 236,606 48,572
Construction work in progress ....................................................... 1,186,433 1,769,545
Total property, plant and equipment ................................................ 31,435,251 28,983,171
Less accumulated depreciation ....................................................... (11,068,820) (10,776,667)
Nuclear fuel ........................................................................ 1,837,697 1,737,469
Less accumulated amortization ...................................................... (1,541,046) (1,435,677)
$ 20,663,082 $ 18,508,296
(a) In 2009, in accordance with the CPUC’s approval of PSCo’s 2007 Colorado resource plan and subsequent rate case decisions, PSCo agreed to early retire its
Cameo Units 1 and 2, Arapahoe Units 3 and 4 and Zuni Units 1 and 2 facilities. In 2010, in response to the CACJA, the CPUC approved the early retirement
of Cherokee Units 1, 2 and 3, Arapahoe Unit 3 and Valmont Unit 5 between 2011 and 2017. Amounts are presented net of accumulated depreciation. See
Item 1 – Public Utility Regulation for further discussion.
4. Borrowings and Other Financing Instruments
Money Pool — Xcel Energy and its utility subsidiaries have established a money pool arrangement that allows for short-term
investments in and borrowings from the utilities between each other. The holding company may make investments in the utility
subsidiaries at market-based interest rates; however, the money pool arrangement does not allow the utility subsidiaries to make
investments in the holding company. The money pool investments and borrowings are eliminated upon consolidation.
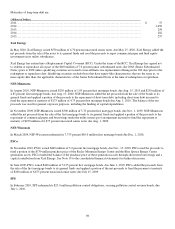
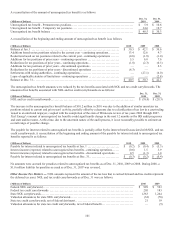
Commercial Paper — Xcel Energy and its utility subsidiaries meet their short-term liquidity requirements primarily through the
issuance of commercial paper and borrowings under their credit facilities. The following table presents commercial paper
outstanding for Xcel Energy:
(Millions of Dollars) Dec. 31, 2010 Dec. 31, 2009
Commercial paper outstanding ......................................................... $ 466 $ 459
Weighted average interest rate ......................................................... 0.40% 0.36
%
Commercial paper borrowing limit..................................................... $ 2,177 $ 2,177
Credit Facilities — Xcel Energy and its utility subsidiaries must have revolving credit facilities in place at least equal to the
amount of their respective commercial paper borrowing limits and cannot issue commercial paper in an aggregate amount
exceeding available capacity under these credit agreements. All credit facility bank borrowings and outstanding commercial paper
reduce the available capacity under the respective credit facilities as presented in the table below. At Dec. 31, 2010 and Dec. 31,
2009, there were no credit facility bank borrowings outstanding.