Xcel Energy 2010 Annual Report Download - page 154
Download and view the complete annual report
Please find page 154 of the 2010 Xcel Energy annual report below. You can navigate through the pages in the report by either clicking on the pages listed below, or by using the keyword search tool below to find specific information within the annual report.-
 1
1 -
2
-
3
-
4
-
5
-
6
-
7
-
8
-
9
-
10
-
11
-
12
-
13
-
14
-
15
-
16
-
17
-
18
-
19
-
20
-
21
-
22
-
23
-
24
-
25
-
26
-
27
-
28
-
29
-
30
-
31
-
32
-
33
-
34
-
35
-
36
-
37
-
38
-
39
-
40
-
41
-
42
-
43
-
44
-
45
-
46
-
47
-
48
-
49
-
50
-
51
-
52
-
53
-
54
-
55
-
56
-
57
-
58
-
59
-
60
-
61
-
62
-
63
-
64
-
65
-
66
-
67
-
68
-
69
-
70
-
71
-
72
-
73
-
74
-
75
-
76
-
77
-
78
-
79
-
80
-
81
-
82
-
83
-
84
-
85
-
86
-
87
-
88
-
89
-
90
-
91
-
92
-
93
-
94
-
95
-
96
-
97
-
98
-
99
-
100
-
101
-
102
-
103
-
104
-
105
-
106
-
107
-
108
-
109
-
110
-
111
-
112
-
113
-
114
-
115
-
116
-
117
-
118
-
119
-
120
-
121
-
122
-
123
-
124
-
125
-
126
-
127
-
128
-
129
-
130
-
131
-
132
-
133
-
134
-
135
-
136
-
137
-
138
-
139
-
140
-
141
-
142
-
143
-
 144
144 -
 145
145 -
 146
146 -
 147
147 -
 148
148 -
 149
149 -
 150
150 -
 151
151 -
 152
152 -
 153
153 -
 154
154 -
 155
155 -
 156
156 -
 157
157 -
 158
158 -
 159
159 -
 160
160 -
 161
161 -
 162
162 -
 163
163 -
 164
164 -
165
-
166
-
167
-
168
-
169
-
170
-
171
-
172
 |
 |

144
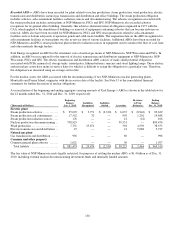
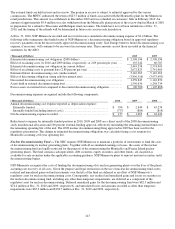
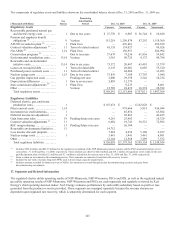
The following tables present the cost and fair value of the investments in the nuclear decommissioning fund, by asset class on
Dec. 31, 2010 and 2009:
2010 2009
(Thousands of Dollars) Cost Fair
Value Cost Fair
Value
Cash equivalents ............................................. $ 83,837 $ 83,837 $ 28,134 $ 28,134
Commingled funds ........................................... 131,000 133,080
—
—
International equity funds ..................................... 54,561 58,584
—
—
Equity securities - Common stock .............................. 436,334 435,270 662,655 581,995
Debt securities
Government securities ...................................... 146,473 146,654 74,162 74,126
U.S. corporate bonds ........................................ 279,028 288,304 299,259 312,844
Foreign securities ........................................... 1,233 1,581 9,269 9,445
Municipal bonds ............................................ 100,277 97,557 147,689 149,088
Asset-backed securities ..................................... 32,558 33,174 11,565 11,918
Mortgage-backed securities .................................. 68,072 72,589 80,276 81,189
Total nuclear decommissioning fund ....................... $ 1,333,373 $ 1,350,630 $ 1,313,009 $ 1,248,739
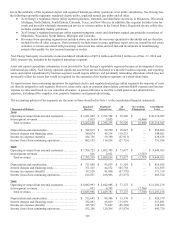
The following table summarizes the final contractual maturity dates of the debt securities in the nuclear decommissioning fund,
by asset class for the year ended Dec. 31, 2010:
Final Contractual Maturity
(Thousands of Dollars)
Due in 1
Year
or Less Due in 1 to 5
Years
Due in 5 to
10
Years Due after 10
Years Total
Government securities ............................ $ 301 $ 117,041 $ 15,270 $ 14,042 $ 146,654
U.S. corporate bonds .............................. 3,071 71,615 178,067 35,551 288,304
Foreign securities .................................
—
1,581
—
—
1,581
Municipal bonds ..................................
—
—
50,729 46,828 97,557
Asset-backed securities ...........................
—
22,232 10,942
—
33,174
Mortgage-backed securities ........................
—
—
1,249 71,340 72,589
Debt securities ................................. $ 3,372 $ 212,469 $ 256,257 $ 167,761 $ 639,859
16. Regulatory Assets and Liabilities
Xcel Energy’s regulated businesses prepare their consolidated financial statements in accordance with the provisions of the
applicable accounting guidance, as discussed in Note 1 to the consolidated financial statements. Under this guidance, regulatory
assets and liabilities can be created for amounts that regulators may allow to be collected, or may require to be paid back to
customers in future electric and natural gas rates. Any portion of Xcel Energy’s business that is not regulated cannot establish
regulatory assets and liabilities. If changes in the utility industry or the business of Xcel Energy no longer allow for the
application of regulatory accounting guidance under GAAP, Xcel Energy would be required to recognize the write-off of
regulatory assets and liabilities in its consolidated statement of income.