Xcel Energy 2010 Annual Report Download - page 124
Download and view the complete annual report
Please find page 124 of the 2010 Xcel Energy annual report below. You can navigate through the pages in the report by either clicking on the pages listed below, or by using the keyword search tool below to find specific information within the annual report.-
 1
1 -
2
-
3
-
4
-
5
-
6
-
7
-
8
-
9
-
10
-
11
-
12
-
13
-
14
-
15
-
16
-
17
-
18
-
19
-
20
-
21
-
22
-
23
-
24
-
25
-
26
-
27
-
28
-
29
-
30
-
31
-
32
-
33
-
34
-
35
-
36
-
37
-
38
-
39
-
40
-
41
-
42
-
43
-
44
-
45
-
46
-
47
-
48
-
49
-
50
-
51
-
52
-
53
-
54
-
55
-
56
-
57
-
58
-
59
-
60
-
61
-
62
-
63
-
64
-
65
-
66
-
67
-
68
-
69
-
70
-
71
-
72
-
73
-
74
-
75
-
76
-
77
-
78
-
79
-
80
-
81
-
82
-
83
-
84
-
85
-
86
-
87
-
88
-
89
-
90
-
91
-
92
-
93
-
94
-
95
-
96
-
97
-
98
-
99
-
100
-
101
-
102
-
103
-
104
-
105
-
106
-
107
-
108
-
109
-
110
-
111
-
112
-
113
-
 114
114 -
 115
115 -
 116
116 -
 117
117 -
 118
118 -
 119
119 -
 120
120 -
 121
121 -
 122
122 -
 123
123 -
 124
124 -
 125
125 -
 126
126 -
 127
127 -
 128
128 -
 129
129 -
 130
130 -
 131
131 -
 132
132 -
 133
133 -
 134
134 -
135
-
136
-
137
-
138
-
139
-
140
-
141
-
142
-
143
-
144
-
145
-
146
-
147
-
148
-
149
-
150
-
151
-
152
-
153
-
154
-
155
-
156
-
157
-
158
-
159
-
160
-
161
-
162
-
163
-
164
-
165
-
166
-
167
-
168
-
169
-
170
-
171
-
172
 |
 |

114
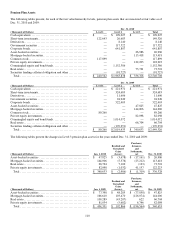
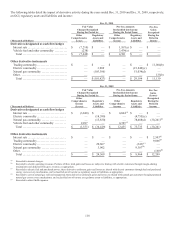
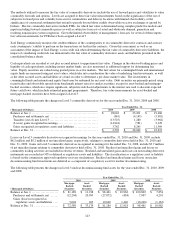
The following tables present the changes in Level 3 postretirement benefit plan assets for the years ended Dec. 31, 2010 and
2009:
(Thousands of Dollars) Jan. 1, 2010
Realized and
Unrealized
Gains
Purchases,
Issuances, and
Settlements,
net Dec. 31,
2010
Asset-backed securities ............................. $ 8,293 $ 1,814 $ (7,522) $ 2,585
Mortgage-backed securities .......................... 47,078 14,715 (42,581) 19,212
(Thousands of Dollars) Jan. 1, 2009
Realized and
Unrealized
Gains
Purchases,
Issuances,
and
Settlements,
net Dec. 31,
2009
Asset-backed securities ............................. $ 8,705 $ 1,029 $ (1,441) $ 8,293
Mortgage-backed securities .......................... 69,988 3,022 (25,932) 47,078
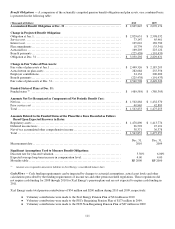
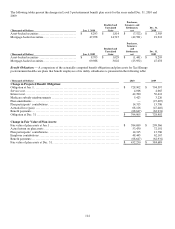
Benefit Obligations — A comparison of the actuarially computed benefit obligation and plan assets for Xcel Energy
postretirement health care plans that benefit employees of its utility subsidiaries is presented in the following table:
(Thousands of Dollars) 2010 2009
Change in Projected Benefit Obligation:
Obligation at Jan. 1 ................................................................... $ 728,902 $ 794,597
Service cost .......................................................................... 4,006 4,665
Interest cost .......................................................................... 42,780 50,412
Medicare subsidy reimbursements ..................................................... 5,423 3,226
Plan amendments .....................................................................
—
(27,407)
Plan participants’ contributions ........................................................ 14,315 13,786
Actuarial loss (gain) .................................................................. 68,126 (47,446)
Benefit payments ..................................................................... (68,647) (62,931)
Obligation at Dec. 31 ................................................................. $ 794,905 $ 728,902
Change in Fair Value of Plan Assets:
Fair value of plan assets at Jan. 1 ....................................................... $ 384,689 $ 299,566
Actual return on plan assets ........................................................... 53,430 72,101
Plan participants’ contributions ........................................................ 14,315 13,786
Employer contributions ............................................................... 48,443 62,167
Benefit payments ..................................................................... (68,647) (62,931)
Fair value of plan assets at Dec. 31..................................................... $ 432,230 $ 384,689