Xcel Energy 2010 Annual Report Download - page 123
Download and view the complete annual report
Please find page 123 of the 2010 Xcel Energy annual report below. You can navigate through the pages in the report by either clicking on the pages listed below, or by using the keyword search tool below to find specific information within the annual report.-
 1
1 -
2
-
3
-
4
-
5
-
6
-
7
-
8
-
9
-
10
-
11
-
12
-
13
-
14
-
15
-
16
-
17
-
18
-
19
-
20
-
21
-
22
-
23
-
24
-
25
-
26
-
27
-
28
-
29
-
30
-
31
-
32
-
33
-
34
-
35
-
36
-
37
-
38
-
39
-
40
-
41
-
42
-
43
-
44
-
45
-
46
-
47
-
48
-
49
-
50
-
51
-
52
-
53
-
54
-
55
-
56
-
57
-
58
-
59
-
60
-
61
-
62
-
63
-
64
-
65
-
66
-
67
-
68
-
69
-
70
-
71
-
72
-
73
-
74
-
75
-
76
-
77
-
78
-
79
-
80
-
81
-
82
-
83
-
84
-
85
-
86
-
87
-
88
-
89
-
90
-
91
-
92
-
93
-
94
-
95
-
96
-
97
-
98
-
99
-
100
-
101
-
102
-
103
-
104
-
105
-
106
-
107
-
108
-
109
-
110
-
111
-
112
-
 113
113 -
 114
114 -
 115
115 -
 116
116 -
 117
117 -
 118
118 -
 119
119 -
 120
120 -
 121
121 -
 122
122 -
 123
123 -
 124
124 -
 125
125 -
 126
126 -
 127
127 -
 128
128 -
 129
129 -
 130
130 -
 131
131 -
 132
132 -
 133
133 -
134
-
135
-
136
-
137
-
138
-
139
-
140
-
141
-
142
-
143
-
144
-
145
-
146
-
147
-
148
-
149
-
150
-
151
-
152
-
153
-
154
-
155
-
156
-
157
-
158
-
159
-
160
-
161
-
162
-
163
-
164
-
165
-
166
-
167
-
168
-
169
-
170
-
171
-
172
 |
 |

113
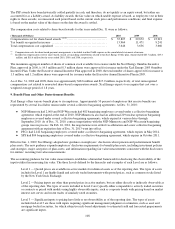
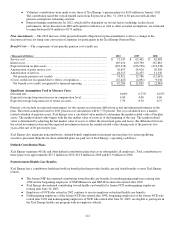
In 1993, Xcel Energy adopted accounting guidance regarding other non-pension postretirement benefits and elected to amortize
the unrecognized APBO on a straight-line basis over 20 years.
Regulatory agencies for nearly all of Xcel Energy’s retail and wholesale utility customers have allowed rate recovery of accrued
postretirement benefit costs. The Colorado jurisdictional postretirement benefit costs deferred during the transition period are
being amortized to expense on a straight-line basis over the 15-year period from 1998 to 2012. NSP-Minnesota also transitioned
to full accrual accounting for postretirement benefit costs, with regulatory differences fully amortized prior to 1997.
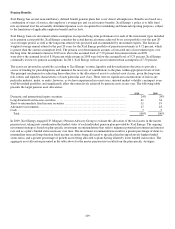
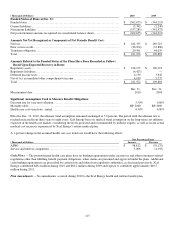
Plan Assets — Certain state agencies that regulate Xcel Energy’s utility subsidiaries also have issued guidelines related to the
funding of postretirement benefit costs. SPS is required to fund postretirement benefit costs for Texas and New Mexico
jurisdictional amounts collected in rates and PSCo is required to fund postretirement benefit costs in irrevocable external trusts
that are dedicated to the payment of these postretirement benefits. Also, a portion of the assets contributed on behalf of
nonbargaining retirees has been funded into a sub-account of the Xcel Energy pension plans. These assets are invested in a
manner consistent with the investment strategy for the pension plan.
Xcel Energy bases its investment-return assumption for the postretirement health care fund assets on expected long-term
performance for each of the investment types included in its asset portfolio. The assets are invested in a portfolio according to
Xcel Energy’s return, liquidity and diversification objectives to provide a source of funding for plan obligations and minimize the
necessity of contributions to the plan, within appropriate levels of risk. The principal mechanism for achieving these objectives is
the allocation of assets to selected asset classes, given the long-term risk, return, and liquidity characteristics of each particular
asset class. There were no significant concentrations of risk in any particular industry, index, or entity. Investment-return
volatility is not considered to be a material factor in postretirement health care costs.
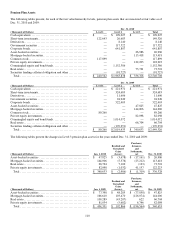
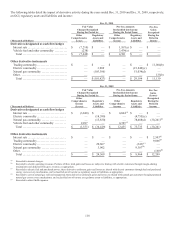
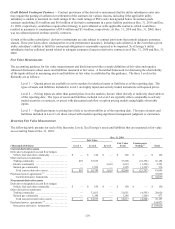
The following tables present, for each of the fair value hierarchy Levels, postretirement benefit plan assets that are measured at
fair value as of Dec. 31, 2010 and 2009:
Dec. 31, 2010
(Thousands of Dollars) Level 1 Level 2 Level 3 Total
Cash equivalents ............................................. $ 72,573 $ 76,352 $
—
$148,925
Derivatives...................................................
—
13,632
—
13,632
Government securities ........................................
—
3,402
—
3,402
Corporate bonds ..............................................
—
70,752
—
70,752
Asset-backed securities .......................................
—
—
2,585 2,585
Mortgage-backed securities ....................................
—
—
19,212 19,212
Preferred stock ...............................................
—
507
—
507
Commingled equity and bond funds............................
—
102,962
—
102,962
Securities lending collateral obligation and other ................
—
70,253
—
70,253
Total ...................................................... $ 72,573 $ 337,860 $ 21,797 $ 432,230
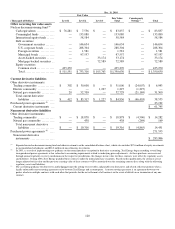
Dec. 31, 2009
(Thousands of Dollars) Level 1 Level 2 Level 3 Total
Cash equivalents ............................................. $
—
$ 165,291 $
—
$165,291
Short-term investments........................................
—
2,226
—
2,226
Derivatives...................................................
—
5,937
—
5,937
Government securities ........................................
—
1,538
—
1,538
Corporate bonds ..............................................
—
60,416
—
60,416
Asset-backed securities .......................................
—
—
8,293 8,293
Mortgage-backed securities ....................................
—
—
47,078 47,078
Preferred stock ...............................................
—
540
—
540
Commingled equity and bond funds............................
—
89,296
—
89,296
Securities lending collateral obligation and other ................
—
4,074
—
4,074
Total ...................................................... $
—
$ 329,318 $ 55,371 $ 384,689