Xcel Energy 2010 Annual Report Download - page 93
Download and view the complete annual report
Please find page 93 of the 2010 Xcel Energy annual report below. You can navigate through the pages in the report by either clicking on the pages listed below, or by using the keyword search tool below to find specific information within the annual report.-
 1
1 -
2
-
3
-
4
-
5
-
6
-
7
-
8
-
9
-
10
-
11
-
12
-
13
-
14
-
15
-
16
-
17
-
18
-
19
-
20
-
21
-
22
-
23
-
24
-
25
-
26
-
27
-
28
-
29
-
30
-
31
-
32
-
33
-
34
-
35
-
36
-
37
-
38
-
39
-
40
-
41
-
42
-
43
-
44
-
45
-
46
-
47
-
48
-
49
-
50
-
51
-
52
-
53
-
54
-
55
-
56
-
57
-
58
-
59
-
60
-
61
-
62
-
63
-
64
-
65
-
66
-
67
-
68
-
69
-
70
-
71
-
72
-
73
-
74
-
75
-
76
-
77
-
78
-
79
-
80
-
81
-
82
-
 83
83 -
 84
84 -
 85
85 -
 86
86 -
 87
87 -
 88
88 -
 89
89 -
 90
90 -
 91
91 -
 92
92 -
 93
93 -
 94
94 -
 95
95 -
 96
96 -
 97
97 -
 98
98 -
 99
99 -
 100
100 -
 101
101 -
 102
102 -
 103
103 -
104
-
105
-
106
-
107
-
108
-
109
-
110
-
111
-
112
-
113
-
114
-
115
-
116
-
117
-
118
-
119
-
120
-
121
-
122
-
123
-
124
-
125
-
126
-
127
-
128
-
129
-
130
-
131
-
132
-
133
-
134
-
135
-
136
-
137
-
138
-
139
-
140
-
141
-
142
-
143
-
144
-
145
-
146
-
147
-
148
-
149
-
150
-
151
-
152
-
153
-
154
-
155
-
156
-
157
-
158
-
159
-
160
-
161
-
162
-
163
-
164
-
165
-
166
-
167
-
168
-
169
-
170
-
171
-
172
 |
 |

83
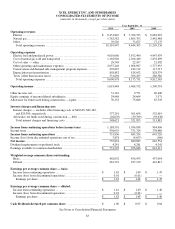
XCEL ENERGY INC. AND SUBSIDIARIES
CONSOLIDATED STATEMENTS OF INCOME
(amounts in thousands, except per share data)
Year Ended Dec. 31
2010 2009 2008
Operating revenues
Electric ........................................................... $ 8,451,845 $ 7,704,723 $ 8,682,993
Natural gas ........................................................ 1,782,582 1,865,703 2,442,988
Other ............................................................. 76,520 73,877 77,175
Total operating revenues ......................................... 10,310,947 9,644,303 11,203,156
Operating expenses
Electric fuel and purchased power................................... 4,010,660 3,672,490 4,947,979
Cost of natural gas sold and transported ............................. 1,162,926 1,266,440 1,832,699
Cost of sales — other .............................................. 29,540 22,107 21,082
Other operating and maintenance expenses .......................... 2,057,249 1,908,097 1,777,933
Conservation and demand side management program expenses........ 239,827 182,112 117,713
Depreciation and amortization ...................................... 858,882 818,052 828,379
Taxes (other than income taxes) .................................... 331,894 306,433 286,580
Total operating expenses ......................................... 8,690,978 8,175,731 9,812,365
Operating income .................................................. 1,619,969 1,468,572 1,390,791
Other income, net .................................................... 31,143 9,771 40,406
Equity earnings of unconsolidated subsidiaries ......................... 29,948 24,664 3,571
Allowance for funds used during construction — equity ................ 56,152 75,686 63,519
Interest charges and financing costs
Interest charges — includes other financing costs of $20,638, $20,162,
and $20,390, respectively ........................................ 577,291 561,654 552,919
Allowance for funds used during construction — debt ................ (28,670) (39,799) (39,038)
Total interest charges and financing costs .......................... 548,621 521,855 513,881
Income from continuing operations before income taxes ............. 1,188,591 1,056,838 984,406
Income taxes ........................................................ 436,635 371,314 338,686
Income from continuing operations ................................. 751,956 685,524 645,720
Income (loss) from discontinued operations, net of tax.................. 3,878 (4,637) (166)
Net income ......................................................... 755,834 680,887 645,554
Dividend requirements on preferred stock ............................. 4,241 4,241 4,241
Earnings available to common shareholders ............................ $ 751,593 $ 676,646 $ 641,313
Weighted average common shares outstanding:
Basic ............................................................. 462,052 456,433 437,054
Diluted ........................................................... 463,391 457,139 441,813
Earnings per average common share — basic:
Income from continuing operations ................................. $ 1.62 $ 1.49 $ 1.47
Income (loss) from discontinued operations .......................... 0.01 (0.01)
—
Earnings per share ............................................... $ 1.63 $ 1.48 $ 1.47
Earnings per average common share — diluted:
Income from continuing operations ................................. $ 1.61 $ 1.49 $ 1.46
Income (loss) from discontinued operations .......................... 0.01 (0.01)
—
Earnings per share ............................................... $ 1.62 $ 1.48 $ 1.46
Cash dividends declared per common share ......................... $ 1.00 $ 0.97 $ 0.94
See Notes to Consolidated Financial Statements