Xcel Energy 2010 Annual Report Download - page 84
Download and view the complete annual report
Please find page 84 of the 2010 Xcel Energy annual report below. You can navigate through the pages in the report by either clicking on the pages listed below, or by using the keyword search tool below to find specific information within the annual report.-
 1
1 -
2
-
3
-
4
-
5
-
6
-
7
-
8
-
9
-
10
-
11
-
12
-
13
-
14
-
15
-
16
-
17
-
18
-
19
-
20
-
21
-
22
-
23
-
24
-
25
-
26
-
27
-
28
-
29
-
30
-
31
-
32
-
33
-
34
-
35
-
36
-
37
-
38
-
39
-
40
-
41
-
42
-
43
-
44
-
45
-
46
-
47
-
48
-
49
-
50
-
51
-
52
-
53
-
54
-
55
-
56
-
57
-
58
-
59
-
60
-
61
-
62
-
63
-
64
-
65
-
66
-
67
-
68
-
69
-
70
-
71
-
72
-
73
-
 74
74 -
 75
75 -
 76
76 -
 77
77 -
 78
78 -
 79
79 -
 80
80 -
 81
81 -
 82
82 -
 83
83 -
 84
84 -
 85
85 -
 86
86 -
 87
87 -
 88
88 -
 89
89 -
 90
90 -
 91
91 -
 92
92 -
 93
93 -
 94
94 -
95
-
96
-
97
-
98
-
99
-
100
-
101
-
102
-
103
-
104
-
105
-
106
-
107
-
108
-
109
-
110
-
111
-
112
-
113
-
114
-
115
-
116
-
117
-
118
-
119
-
120
-
121
-
122
-
123
-
124
-
125
-
126
-
127
-
128
-
129
-
130
-
131
-
132
-
133
-
134
-
135
-
136
-
137
-
138
-
139
-
140
-
141
-
142
-
143
-
144
-
145
-
146
-
147
-
148
-
149
-
150
-
151
-
152
-
153
-
154
-
155
-
156
-
157
-
158
-
159
-
160
-
161
-
162
-
163
-
164
-
165
-
166
-
167
-
168
-
169
-
170
-
171
-
172
 |
 |

74
Cash used in investing activities increased by $1.1 billion during 2010, primarily due to the acquisition of two natural-gas fired
generation facilities and increased investment in utility operations primarily at PSCo, including the completion of Comanche Unit
3.
Cash used in investing activities decreased by $422 million during 2009, primarily due to reduced capital expenditures; a
withdrawal of funds, to refund customers, from the external decommissioning fund as approved by the MPUC; as well as reduced
investment in the WYCO natural gas pipeline and storage project. No cash was provided by investing activities for discontinued
operations.
(Millions of Dollars) 2010 2009 2008
Cash provided by (used in) financing activities .. .. ....................... .. $ 906 $ (322) $ 671
Cash provided by financing activities increased by $1.2 billion during 2010. The increase was primarily attributable to higher
proceeds from the issuance of long-term debt and common stock.
Cash used in financing activities increased by $993 million during 2009, primarily due to lower proceeds from the issuances of
long-term debt and common stock and an increase in dividends, partially offset by lower repayments of short-term borrowings.
See discussion of trends, commitments and uncertainties with the potential for future impact on cash flow and liquidity under
Capital Sources.
Capital Requirements
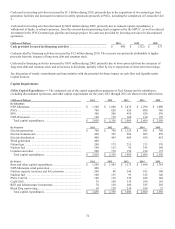
Utility Capital Expenditures — The estimated cost of the capital expenditure programs of Xcel Energy and its subsidiaries,
excluding discontinued operations, and other capital requirements for the years 2011 through 2015 are shown in the tables below.
(Millions of Dollars) 2011 2012 2013 2014 2015
By Subsidiary
N
SP-Minnesota ......... ............... .... .... .. ...... $ 1,300 $ 1,080 $ 1,470 $ 1,290 $ 1,090
PSCo ........ ..... .... ................................. 700 820 920 880 760
SPS .. ...... .... .... .... .. ...................... ....... 300 280 450 420 530
N
SP-Wisconsin ...... .. .......... .. .................... 150 170 160 210 170
Total capital expenditures .. .. .. .... .. .... ............. $ 2,450 $ 2,350 $ 3,000 $ 2,800 $ 2,550
By Function 2011 2012 2013 2014 2015
Electric generation . ..... .... .......... ................. $ 700 $ 700 $ 1,120 $ 945 $ 740
Electric transmission .. .. .. .. .......... ................ . 450 705 960 865 870
Electric distribution ... .......... .. .... ................. 400 445 460 450 455
Wind generation ............ .... .. ..................... 400
—
—
—
—
N
atural gas ..... ........ .. .... ........................ . 200 175 215 215 170
N
uclear fuel . .......... .. .......................... .... 100 155 95 145 140
Common and other .... .. .... .............. .... .... ..... 200 170 150 180 175
Total capital expenditures .. .. .. .... .. .... ............. $ 2,450 $ 2,350 $ 3,000 $ 2,800 $ 2,550
By Project 2011 2012 2013 2014 2015
Base and other capital expenditures .. .. .. .. .... .... ...... $ 1,500 $ 1,485 $ 1,575 $ 1,640 $ 1,785
N
SP-Minnesota wind generation .. .. .. .......... .. ....... 400
—
—
—
—
N
uclear capacity increases and life extension . ............ 200 80 240 105 100
N
uclear fuel . .......... .. .......................... .... 100 155 95 145 140
PSCo CACJA ............................. .. ....... .. . 100 170 330 245 140
CapX2020 .... .. .. .................................... . 70 190 330 290 145
RES and infrastructure investments ... .. .. .... .. .... ..... 70 150 200 185 205
Black Dog repowering ... .. .. ..... .... .. .............. .. 10 120 230 190 35
Total capital expenditures .. .. .. .... .. .... ............. $ 2,450 $ 2,350 $ 3,000 $ 2,800 $ 2,550