Xcel Energy 2010 Annual Report Download - page 122
Download and view the complete annual report
Please find page 122 of the 2010 Xcel Energy annual report below. You can navigate through the pages in the report by either clicking on the pages listed below, or by using the keyword search tool below to find specific information within the annual report.-
 1
1 -
2
-
3
-
4
-
5
-
6
-
7
-
8
-
9
-
10
-
11
-
12
-
13
-
14
-
15
-
16
-
17
-
18
-
19
-
20
-
21
-
22
-
23
-
24
-
25
-
26
-
27
-
28
-
29
-
30
-
31
-
32
-
33
-
34
-
35
-
36
-
37
-
38
-
39
-
40
-
41
-
42
-
43
-
44
-
45
-
46
-
47
-
48
-
49
-
50
-
51
-
52
-
53
-
54
-
55
-
56
-
57
-
58
-
59
-
60
-
61
-
62
-
63
-
64
-
65
-
66
-
67
-
68
-
69
-
70
-
71
-
72
-
73
-
74
-
75
-
76
-
77
-
78
-
79
-
80
-
81
-
82
-
83
-
84
-
85
-
86
-
87
-
88
-
89
-
90
-
91
-
92
-
93
-
94
-
95
-
96
-
97
-
98
-
99
-
100
-
101
-
102
-
103
-
104
-
105
-
106
-
107
-
108
-
109
-
110
-
111
-
 112
112 -
 113
113 -
 114
114 -
 115
115 -
 116
116 -
 117
117 -
 118
118 -
 119
119 -
 120
120 -
 121
121 -
 122
122 -
 123
123 -
 124
124 -
 125
125 -
 126
126 -
 127
127 -
 128
128 -
 129
129 -
 130
130 -
 131
131 -
 132
132 -
133
-
134
-
135
-
136
-
137
-
138
-
139
-
140
-
141
-
142
-
143
-
144
-
145
-
146
-
147
-
148
-
149
-
150
-
151
-
152
-
153
-
154
-
155
-
156
-
157
-
158
-
159
-
160
-
161
-
162
-
163
-
164
-
165
-
166
-
167
-
168
-
169
-
170
-
171
-
172
 |
 |

112
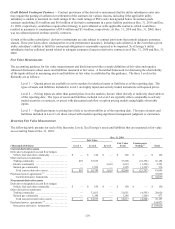
● Voluntary contributions were made across three of Xcel Energy’s pension plans for $134 million in January 2011.
The contribution raised the overall funded status from 84 percent at Dec. 31, 2010 to 88 percent with all other
pension assumptions remaining constant.
● Pension funding contributions for 2012, which will be dependent on several factors including, realized asset
performance, future discount rate, IRS and legislative initiatives as well as other actuarial assumptions, are estimated
to range between $150 million to $175 million.
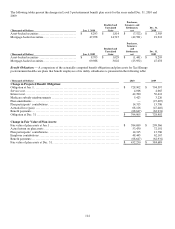
Plan Amendments — The 2010 increase of the projected benefit obligation for plan amendments is due to a change in the
discount rate basis for lump sum conversion of annuities for participants in the Xcel Energy Pension Plan.
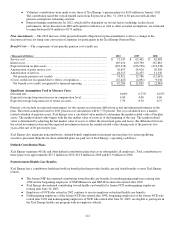
Benefit Costs — The components of net periodic pension cost (credit) are:
(Thousands of Dollars) 2010 2009 2008
Service cost ................................................................ $ 73,147 $ 65,461 $ 62,698
Interest cost ................................................................ 165,010 169,790 167,881
Expected return on plan assets ............................................... (232,318) (256,538) (274,338)
Amortization of prior service cost ............................................ 20,657 24,618 20,584
Amortization of net loss ..................................................... 48,315 12,455 11,156
Net periodic pension cost (credit) ......................................... 74,811 15,786 (12,019)
(Costs) credits not recognized due to effects of regulation ...................... (27,027) (2,891) 9,034
Net benefit cost (credit) recognized for financial reporting ................... $ 47,784 $ 12,895 $ (2,985)
Significant Assumptions Used to Measure Costs:
Discount rate ............................................................... 6.00% 6.75% 6.25
%
Expected average long-term increase in compensation level .................... 4.00 4.00 4.00
Expected average long-term rate of return on assets ............................ 7.79 8.50 8.75
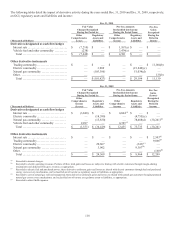
Pension costs include an expected return impact for the current year that may differ from actual investment performance in the
plan. The return assumption used for 2011 pension cost calculations will be 7.50 percent. The cost calculation uses a market-
related valuation of pension assets. Xcel Energy uses a calculated value method to determine the market-related value of the plan
assets. The market-related value begins with the fair market value of assets as of the beginning of the year. The market-related
value is determined by adjusting the fair market value of assets to reflect the investment gains and losses (the difference between
the actual investment return and the expected investment return on the market-related value) during each of the previous five
years at the rate of 20 percent per year.
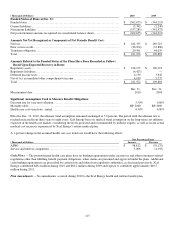
Xcel Energy also maintains noncontributory, defined benefit supplemental retirement income plans for certain qualifying
executive personnel. Benefits for these unfunded plans are paid out of Xcel Energy’s operating cash flows.
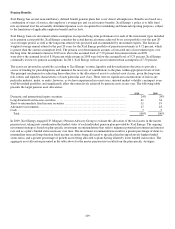
Defined Contribution Plans
Xcel Energy maintains 401(k) and other defined contribution plans that cover substantially all employees. Total contributions to
these plans were approximately $27.3 million in 2010, $21.9 million in 2009 and $17.9 million in 2008.
Postretirement Health Care Benefits
Xcel Energy has a contributory health and welfare benefit plan that provides health care and death benefits to most Xcel Energy
retirees.
● The former NSP discontinued contributing toward health care benefits for nonbargaining employees retiring after
1998 and for bargaining employees of NSP-Minnesota and NSP-Wisconsin who retired after 1999.
● Xcel Energy discontinued contributing toward health care benefits for former NCE nonbargaining employees
retiring after June 30, 2003.
● Employees of NCE who retired in 2002 continue to receive employer-subsidized health care benefits.
● Nonbargaining employees of the former NCE who retired after 1998, bargaining employees of the former NCE who
retired after 1999 and nonbargaining employees of NCE who retired after June 30, 2003, are eligible to participate in
the Xcel Energy health care program with no employer subsidy.