Xcel Energy 2010 Annual Report Download - page 63
Download and view the complete annual report
Please find page 63 of the 2010 Xcel Energy annual report below. You can navigate through the pages in the report by either clicking on the pages listed below, or by using the keyword search tool below to find specific information within the annual report.-
 1
1 -
2
-
3
-
4
-
5
-
6
-
7
-
8
-
9
-
10
-
11
-
12
-
13
-
14
-
15
-
16
-
17
-
18
-
19
-
20
-
21
-
22
-
23
-
24
-
25
-
26
-
27
-
28
-
29
-
30
-
31
-
32
-
33
-
34
-
35
-
36
-
37
-
38
-
39
-
40
-
41
-
42
-
43
-
44
-
45
-
46
-
47
-
48
-
49
-
50
-
51
-
52
-
 53
53 -
 54
54 -
 55
55 -
 56
56 -
 57
57 -
 58
58 -
 59
59 -
 60
60 -
 61
61 -
 62
62 -
 63
63 -
 64
64 -
 65
65 -
 66
66 -
 67
67 -
 68
68 -
 69
69 -
 70
70 -
 71
71 -
 72
72 -
 73
73 -
74
-
75
-
76
-
77
-
78
-
79
-
80
-
81
-
82
-
83
-
84
-
85
-
86
-
87
-
88
-
89
-
90
-
91
-
92
-
93
-
94
-
95
-
96
-
97
-
98
-
99
-
100
-
101
-
102
-
103
-
104
-
105
-
106
-
107
-
108
-
109
-
110
-
111
-
112
-
113
-
114
-
115
-
116
-
117
-
118
-
119
-
120
-
121
-
122
-
123
-
124
-
125
-
126
-
127
-
128
-
129
-
130
-
131
-
132
-
133
-
134
-
135
-
136
-
137
-
138
-
139
-
140
-
141
-
142
-
143
-
144
-
145
-
146
-
147
-
148
-
149
-
150
-
151
-
152
-
153
-
154
-
155
-
156
-
157
-
158
-
159
-
160
-
161
-
162
-
163
-
164
-
165
-
166
-
167
-
168
-
169
-
170
-
171
-
172
 |
 |

53
Investing in Our Utilities
The second phase is investing in our utilities. Xcel Energy is projected to spend approximately $13 billion in capital investment
from 2011 through 2015, as disclosed in more detail in the Capital Requirements section and in Note 14 to the consolidated
financial statements. In addition to Xcel Energy’s normal level of capital investment, Xcel Energy expects to have significant
investment opportunity, in part attributable to the environmental strategy described above.
As a result of these investments, as well as continued investments in the transmission and distribution system, Xcel Energy
expects that the rate base, or the amount on which Xcel Energy earns a return, will grow annually, on average, by more than 7
percent from 2011 through 2015.
Earning a Fair Return
The third phase is earning a fair return on utility system investments. To this end, the regulatory strategy is to receive regulatory
approval for rate riders and DSM incentives, as well as general rate cases. A rate rider is a mechanism that allows recovery of
certain costs and returns on investments without the costs and delays of filing a rate case. These riders allow for timely revenue
recovery of the costs of large projects or other costs that vary over time. DSM incentives which exist in Colorado and New
Mexico, and CIP incentives in Minnesota, allow Xcel Energy to earn from helping our customers reduce consumption. The
incentive plans are designed to reward Xcel Energy for achieving performance at or above the approved savings goals.
Xcel Energy’s regulatory strategy is based on filing reasonable rate requests designed to provide recovery of legitimate expenses
and a return on utility investments. Xcel Energy believes that the public utility commissions will provide reasonable recovery, and
it is important to note that the financial plans include this assumption. Constructive results over the last several years are evidence
of reasonable regulatory treatment and give Xcel Energy confidence that Xcel Energy is pursuing the right strategy. With any
strategic plan, there are goals and objectives. Xcel Energy feels the following financial objectives continue to be achievable:
● A long-term annual earnings per share growth rate target of 5 percent to 7 percent;
● Annual dividend increases of 2 percent to 4 percent; and
● Senior unsecured debt credit ratings in the BBB+ to A range.
Successful execution of the corporate strategic plan should allow Xcel Energy to achieve the outlined financial objectives, which
in turn, should provide investors with an attractive total return on a low-risk investment.
Optimizing a Portfolio of Operating Utilities
Optimizing the management of a portfolio of operating utilities is the third area of focus related to the corporate strategy. Even
though Xcel Energy ultimately manages the business based on the revenue streams provided by electricity and natural gas, Xcel
Energy continues to evolve the management of the portfolio of utility investments. While Xcel Energy has four separate operating
companies, there are certain similarities and differences that require us to effectively manage this portfolio. More specifically,
Xcel Energy’s goal is to build on the similarities among the companies, which maximizes efficiencies from centralized
management and deployment of common initiatives, such as market branding and environmental policy research. From an
organizational perspective, examples of similarities include corporate center services as well as certain operational functions, such
as management of the generation fleet, transmission systems, environmental compliance, government and legislative compliance,
NERC and FERC compliance and safety programs.
At the same time, Xcel Energy realizes there are unique differences in each of our service territories such as local community
focus and priorities, regulatory environment, physical plant infrastructure and age, weather, as well as others that require Xcel
Energy to organize and align these utility specific areas to most effectively address these utility distinct characteristics. To that
end, Xcel Energy has operating company presidents, each located in their respective jurisdiction. The objective of this
organizational structure is to optimize Xcel Energy’s operating efficiency while maximizing accountability.
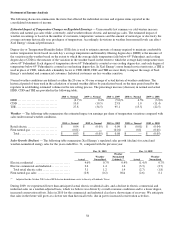
Financial Review
The following discussion and analysis by management focuses on those factors that had a material effect on Xcel Energy’s
financial condition, results of operations and cash flows during the periods presented, or are expected to have a material impact in
the future. It should be read in conjunction with the accompanying consolidated financial statements and the related notes to
consolidated financial statements.