Xcel Energy 2010 Annual Report Download - page 167
Download and view the complete annual report
Please find page 167 of the 2010 Xcel Energy annual report below. You can navigate through the pages in the report by either clicking on the pages listed below, or by using the keyword search tool below to find specific information within the annual report.-
 1
1 -
2
-
3
-
4
-
5
-
6
-
7
-
8
-
9
-
10
-
11
-
12
-
13
-
14
-
15
-
16
-
17
-
18
-
19
-
20
-
21
-
22
-
23
-
24
-
25
-
26
-
27
-
28
-
29
-
30
-
31
-
32
-
33
-
34
-
35
-
36
-
37
-
38
-
39
-
40
-
41
-
42
-
43
-
44
-
45
-
46
-
47
-
48
-
49
-
50
-
51
-
52
-
53
-
54
-
55
-
56
-
57
-
58
-
59
-
60
-
61
-
62
-
63
-
64
-
65
-
66
-
67
-
68
-
69
-
70
-
71
-
72
-
73
-
74
-
75
-
76
-
77
-
78
-
79
-
80
-
81
-
82
-
83
-
84
-
85
-
86
-
87
-
88
-
89
-
90
-
91
-
92
-
93
-
94
-
95
-
96
-
97
-
98
-
99
-
100
-
101
-
102
-
103
-
104
-
105
-
106
-
107
-
108
-
109
-
110
-
111
-
112
-
113
-
114
-
115
-
116
-
117
-
118
-
119
-
120
-
121
-
122
-
123
-
124
-
125
-
126
-
127
-
128
-
129
-
130
-
131
-
132
-
133
-
134
-
135
-
136
-
137
-
138
-
139
-
140
-
141
-
142
-
143
-
144
-
145
-
146
-
147
-
148
-
149
-
150
-
151
-
152
-
153
-
154
-
155
-
156
-
 157
157 -
 158
158 -
 159
159 -
 160
160 -
 161
161 -
 162
162 -
 163
163 -
 164
164 -
 165
165 -
 166
166 -
 167
167 -
 168
168 -
 169
169 -
 170
170 -
 171
171 -
 172
172
 |
 |

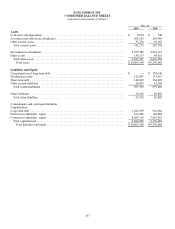
157
XCEL ENERGY INC.
CONDENSED BALANCE SHEETS
(amounts in thousands of dollars)
Dec. 31
2010 2009
Assets
Cash and cash equivalents ...............................................................
.
$ 9,654 $ 748
Accounts receivable from subsidiaries ....................................................
.
266,323 264,789
Other current assets .....................................................................
.
35,276 30,165
Total current assets ....................................................................
.
311,253 295,702
Investment in subsidiaries ...............................................................
.
9,559,780 8,876,145
Other assets ............................................................................
.
134,157 64,813
Total other assets .....................................................................
.
9,693,937 8,940,958
Total assets .........................................................................
.
$ 10,005,190 $ 9,236,660
Liabilities and Equity
Current portion of long-term debt ........................................................
.
$
—
$358,636
Dividends payable ......................................................................
.
122,847 113,147
Short-term debt .........................................................................
.
148,000 364,000
Other current liabilities ..................................................................
.
24,453 43,503
Total current liabilities ................................................................
.
295,300 879,286
Other liabilities .........................................................................
.
29,192 26,885
Total other liabilities ..................................................................
.
29,192 26,885
Commitments and contingent liabilities
Capitalization
Long-term debt .........................................................................
.
1,492,199 942,264
Preferred stockholders’ equity ............................................................
.
104,980 104,980
Common stockholders’ equity ............................................................
.
8,083,519 7,283,245
Total capitalization ....................................................................
.
9,680,698 8,330,489
Total liabilities and equity ...........................................................
.
$ 10,005,190 $ 9,236,660