Xcel Energy 2010 Annual Report Download - page 116
Download and view the complete annual report
Please find page 116 of the 2010 Xcel Energy annual report below. You can navigate through the pages in the report by either clicking on the pages listed below, or by using the keyword search tool below to find specific information within the annual report.-
 1
1 -
2
-
3
-
4
-
5
-
6
-
7
-
8
-
9
-
10
-
11
-
12
-
13
-
14
-
15
-
16
-
17
-
18
-
19
-
20
-
21
-
22
-
23
-
24
-
25
-
26
-
27
-
28
-
29
-
30
-
31
-
32
-
33
-
34
-
35
-
36
-
37
-
38
-
39
-
40
-
41
-
42
-
43
-
44
-
45
-
46
-
47
-
48
-
49
-
50
-
51
-
52
-
53
-
54
-
55
-
56
-
57
-
58
-
59
-
60
-
61
-
62
-
63
-
64
-
65
-
66
-
67
-
68
-
69
-
70
-
71
-
72
-
73
-
74
-
75
-
76
-
77
-
78
-
79
-
80
-
81
-
82
-
83
-
84
-
85
-
86
-
87
-
88
-
89
-
90
-
91
-
92
-
93
-
94
-
95
-
96
-
97
-
98
-
99
-
100
-
101
-
102
-
103
-
104
-
105
-
 106
106 -
 107
107 -
 108
108 -
 109
109 -
 110
110 -
 111
111 -
 112
112 -
 113
113 -
 114
114 -
 115
115 -
 116
116 -
 117
117 -
 118
118 -
 119
119 -
 120
120 -
 121
121 -
 122
122 -
 123
123 -
 124
124 -
 125
125 -
 126
126 -
127
-
128
-
129
-
130
-
131
-
132
-
133
-
134
-
135
-
136
-
137
-
138
-
139
-
140
-
141
-
142
-
143
-
144
-
145
-
146
-
147
-
148
-
149
-
150
-
151
-
152
-
153
-
154
-
155
-
156
-
157
-
158
-
159
-
160
-
161
-
162
-
163
-
164
-
165
-
166
-
167
-
168
-
169
-
170
-
171
-
172
 |
 |

106
Xcel Energy granted shares of restricted stock for the years ended Dec. 31 as follows:
(Shares in Thousands) 2010 2009 2008
Granted shares ............................................................. 44
—
28
Grant date fair value ........................................................ $ 20.47 $
—
$ 20.62
A summary of the changes of nonvested restricted stock for the year ended Dec. 31, 2010 were as follows:
(Shares in Thousands) Shares
Weighted
Average
Grant Date
Fair Value
N
onvested restricted stock at Jan. 1, 2010 ..................................................
.
32 $ 21.77
Granted .................................................................................
.
44 20.47
Vested ..................................................................................
.
(23) 22.85
Dividend equivalents .....................................................................
.
2 21.98
N
onvested restricted stock at Dec. 31, 2010 ................................................
.
55 20.28
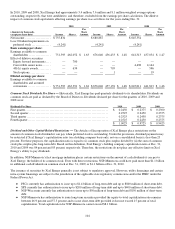
Restricted Stock Units (RSUs) — Xcel Energy’s Board of Directors has granted RSUs under the Xcel Energy Omnibus Incentive
Plan approved by the shareholders in 2000 and under the Xcel Energy 2005 Omnibus Incentive Plan. Both plans allow the
attachment of various performance goals to the RSUs granted. The performance goals may vary by plan year. The restrictions on
RSUs will not lapse, even if performance goals have been achieved, until two years after the grant date.
Payout of the RSUs and the lapsing of restrictions on the transfer of units are based on one of two separate performance criteria.
A portion of the awarded units, plus associated earned dividend equivalents, will be settled and the restricted period will lapse
after Xcel Energy achieves a specified EPS growth (adjusted for COLI for grant years prior to 2008). Additionally, Xcel Energy’s
annual dividend paid on its common stock must remain at a specified amount per share or greater. EPS growth will be measured
annually at the end of each fiscal year. The remaining awarded units, plus associated earned dividend equivalents, will be settled
and the restricted period will lapse after the results of environmental performance, measured as a percentage of target
performance, meets or exceeds threshold performance. The environmental performance indicators will be measured annually at
the end of each fiscal year. If the performance criteria have not been met within four years of the date of grant, all associated units
shall be forfeited.
The 2005 RSUs measured on EPS growth and all 2006 RSUs met their targets as of Dec. 31, 2007 and were settled in shares in
February 2008. In addition, the 2007 environmental RSUs met their target as of Dec. 31, 2009 and were settled in shares in
February 2010. The 2007 RSUs measured on EPS growth and all 2008 RSUs met their targets as of Dec. 31, 2010 and were
settled in shares in February 2011.
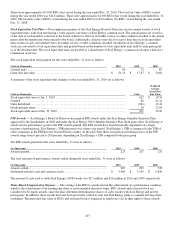
The RSUs granted for the years ended Dec. 31 were as follows:
(Units in Thousands) 2010 2009 2008
Granted units .............................................................. 601 597 460
Weighted average grant date fair value ....................................... $ 21.26 $ 18.88 $ 20.60
A summary of the changes of nonvested RSUs for the year ended Dec. 31, 2010, were as follows:
(Units in Thousands) Units
Weighted
Average
Grant Date
Fair Value
N
onvested restricted stock units at Jan. 1, 2010 .............................................
.
1,199 $ 19.52
Granted .................................................................................
.
601 21.26
Forfeited ................................................................................
.
(106) 19.84
Vested ..................................................................................
.
(627) 20.11
Dividend equivalents .....................................................................
.
71 19.95
N
onvested restricted stock units at Dec. 31, 2010 ...........................................
.
1,138 20.12
The total fair value of nonvested RSUs as of Dec. 31, 2010 was $26.8 million and the weighted average remaining contractual life
was 2.7 years.