Xcel Energy 2010 Annual Report Download - page 121
Download and view the complete annual report
Please find page 121 of the 2010 Xcel Energy annual report below. You can navigate through the pages in the report by either clicking on the pages listed below, or by using the keyword search tool below to find specific information within the annual report.-
 1
1 -
2
-
3
-
4
-
5
-
6
-
7
-
8
-
9
-
10
-
11
-
12
-
13
-
14
-
15
-
16
-
17
-
18
-
19
-
20
-
21
-
22
-
23
-
24
-
25
-
26
-
27
-
28
-
29
-
30
-
31
-
32
-
33
-
34
-
35
-
36
-
37
-
38
-
39
-
40
-
41
-
42
-
43
-
44
-
45
-
46
-
47
-
48
-
49
-
50
-
51
-
52
-
53
-
54
-
55
-
56
-
57
-
58
-
59
-
60
-
61
-
62
-
63
-
64
-
65
-
66
-
67
-
68
-
69
-
70
-
71
-
72
-
73
-
74
-
75
-
76
-
77
-
78
-
79
-
80
-
81
-
82
-
83
-
84
-
85
-
86
-
87
-
88
-
89
-
90
-
91
-
92
-
93
-
94
-
95
-
96
-
97
-
98
-
99
-
100
-
101
-
102
-
103
-
104
-
105
-
106
-
107
-
108
-
109
-
110
-
 111
111 -
 112
112 -
 113
113 -
 114
114 -
 115
115 -
 116
116 -
 117
117 -
 118
118 -
 119
119 -
 120
120 -
 121
121 -
 122
122 -
 123
123 -
 124
124 -
 125
125 -
 126
126 -
 127
127 -
 128
128 -
 129
129 -
 130
130 -
 131
131 -
132
-
133
-
134
-
135
-
136
-
137
-
138
-
139
-
140
-
141
-
142
-
143
-
144
-
145
-
146
-
147
-
148
-
149
-
150
-
151
-
152
-
153
-
154
-
155
-
156
-
157
-
158
-
159
-
160
-
161
-
162
-
163
-
164
-
165
-
166
-
167
-
168
-
169
-
170
-
171
-
172
 |
 |

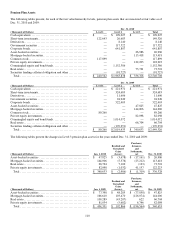
111
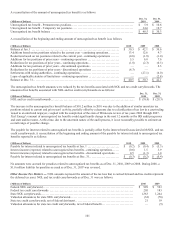
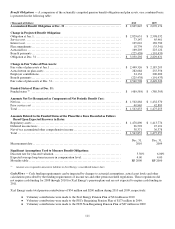
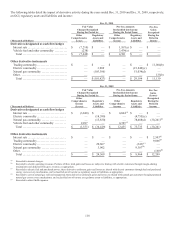
Benefit Obligations — A comparison of the actuarially computed pension benefit obligation and plan assets, on a combined basis,
is presented in the following table:
(Thousands of Dollars) 2010 2009
Accumulated Benefit Obligation at Dec. 31 ............................................ $ 2,865,845 $ 2,676,174
Change in Projected Benefit Obligation:
Obligation at Jan. 1 .................................................................... $ 2,829,631 $ 2,598,032
Service cost ........................................................................... 73,147 65,461
Interest cost ........................................................................... 165,010 169,790
Plan amendments ...................................................................... 18,739 (35,341)
Actuarial loss ......................................................................... 169,203 223,122
Benefit payments ...................................................................... (225,438 ) (191,433)
Obligation at Dec. 31 .................................................................. $ 3,030,292 $ 2,829,631
Change in Fair Value of Plan Assets:
Fair value of plan assets at Jan. 1 ........................................................ $ 2,449,326 $ 2,185,203
Actual return on plan assets ............................................................ 282,688 255,556
Employer contributions ................................................................ 34,132 200,000
Benefit payments ...................................................................... (225,438 ) (191,433)
Fair value of plan assets at Dec. 31...................................................... $ 2,540,708 $ 2,449,326
Funded Status of Plans at Dec. 31:
Funded status (a) ...................................................................... $ (489,584 ) $ (380,305)
Amounts Not Yet Recognized as Components of Net Periodic Benefit Cost:
N
et loss ............................................................................... $ 1,502,888 $ 1,432,370
Prior service cost ...................................................................... 40,965 42,883
Total ................................................................................. $ 1,543,853 $ 1,475,253
Amounts Related to the Funded Status of the Plans Have Been Recorded as Follows
Based Upon Expected Recovery in Rates:
Regulatory assets ...................................................................... $ 1,478,890 $ 1,413,774
Deferred income taxes ................................................................. 26,592 25,101
N
e
t
-of-tax accumulated other comprehensive income..................................... 38,371 36,378
Total ................................................................................. $ 1,543,853 $ 1,475,253
Measurement date ..................................................................... Dec. 31,
2010 Dec. 31,
2009
Significant Assumptions Used to Measure Benefit Obligations:
Discount rate for year-end valuation..................................................... 5.50 % 6.00
%
Expected average long-term increase in compensation level ............................... 4.00 4.00
Mortality table ........................................................................ RP 2000 RP 2000
(a) Amounts are recognized in noncurrent liabilities on Xcel Energy’s consolidated balance sheet.
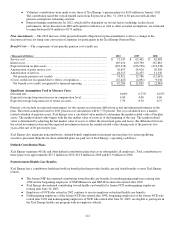
Cash Flows — Cash funding requirements can be impacted by changes to actuarial assumptions, actual asset levels and other
calculations prescribed by the funding requirements of income tax and other pension-related regulations. These regulations did
not require cash funding for 2008 through 2010 for Xcel Energy’s pension plans and are not expected to require cash funding in
2011.
Xcel Energy made total pension contributions of $34 million and $200 million during 2010 and 2009, respectively.
● Voluntary contributions were made to the Xcel Energy Pension Plan of $34 million in 2010.
● Voluntary contributions were made to the PSCo Bargaining Pension Plan of $173 million in 2009.
● Voluntary contributions were made to the NCE Non-Bargaining Pension Plan of $27 million in 2009.