Xcel Energy 2010 Annual Report Download - page 112
Download and view the complete annual report
Please find page 112 of the 2010 Xcel Energy annual report below. You can navigate through the pages in the report by either clicking on the pages listed below, or by using the keyword search tool below to find specific information within the annual report.-
 1
1 -
2
-
3
-
4
-
5
-
6
-
7
-
8
-
9
-
10
-
11
-
12
-
13
-
14
-
15
-
16
-
17
-
18
-
19
-
20
-
21
-
22
-
23
-
24
-
25
-
26
-
27
-
28
-
29
-
30
-
31
-
32
-
33
-
34
-
35
-
36
-
37
-
38
-
39
-
40
-
41
-
42
-
43
-
44
-
45
-
46
-
47
-
48
-
49
-
50
-
51
-
52
-
53
-
54
-
55
-
56
-
57
-
58
-
59
-
60
-
61
-
62
-
63
-
64
-
65
-
66
-
67
-
68
-
69
-
70
-
71
-
72
-
73
-
74
-
75
-
76
-
77
-
78
-
79
-
80
-
81
-
82
-
83
-
84
-
85
-
86
-
87
-
88
-
89
-
90
-
91
-
92
-
93
-
94
-
95
-
96
-
97
-
98
-
99
-
100
-
101
-
 102
102 -
 103
103 -
 104
104 -
 105
105 -
 106
106 -
 107
107 -
 108
108 -
 109
109 -
 110
110 -
 111
111 -
 112
112 -
 113
113 -
 114
114 -
 115
115 -
 116
116 -
 117
117 -
 118
118 -
 119
119 -
 120
120 -
 121
121 -
 122
122 -
123
-
124
-
125
-
126
-
127
-
128
-
129
-
130
-
131
-
132
-
133
-
134
-
135
-
136
-
137
-
138
-
139
-
140
-
141
-
142
-
143
-
144
-
145
-
146
-
147
-
148
-
149
-
150
-
151
-
152
-
153
-
154
-
155
-
156
-
157
-
158
-
159
-
160
-
161
-
162
-
163
-
164
-
165
-
166
-
167
-
168
-
169
-
170
-
171
-
172
 |
 |

102
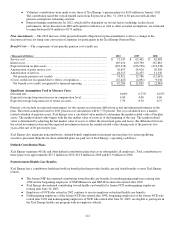
The federal carryforward periods expire between 2021 and 2030. The state carryforward periods expire between 2011 and 2030.
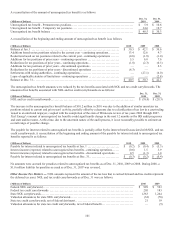
Total income tax expense from continuing operations differs from the amount computed by applying the statutory federal income
tax rate to income before income tax expense. The following reconciles such differences for the years ending Dec. 31:
2010 2009 2008
Federal statutory rate.................................................................. 35.0% 35.0% 35.0%
Increases (decreases) in tax from:
State income taxes, net of federal income tax benefit................................... 3.9 4.0 4.4
Tax credits recognized, net of federal income tax expense.............................. (1.8) (2.0) (1.8)
Regulatory differences — utility plant items .......................................... (1.1) (2.0) (2.1)
Resolution of income tax audits and other ............................................ 0.6 0.8
—
Change in unrecognized tax benefits ................................................. 0.1 (0.5) (0.1)
Life insurance policies .............................................................. (0.8) (0.2) (0.2)
Previously recognized Medicare Part D subsidies ...................................... 1.4
—
—
Other, net .......................................................................... (0.6)
—
(0.8)
Effective income tax rate from continuing operations .................................... 36.7% 35.1% 34.4%
The components of Xcel Energy’s income tax expense for the years ending Dec. 31 were:
(Thousands of Dollars) 2010 2009 2008
Current federal tax expense (benefit) .............................................
.
$ 16,657 $ (39,886) $ 56,044
Current state tax expense ........................................................
.
12,580 8,672 26,904
Current change in unrecognized tax expense (benefit) .............................
.
(2,982) (7,627) 3,891
Current tax credits ..............................................................
.
(944)
—
—
Deferred federal tax expense.....................................................
.
376,073 360,252 236,307
Deferred state tax expense .......................................................
.
52,543 69,947 38,758
Deferred change in unrecognized tax expense (benefit) ...........................
.
4,641 2,387 (4,535)
Deferred tax credits .............................................................
.
(15,580) (16,005) (11,485)
Deferred investment tax credits ..................................................
.
(6,353) (6,426) (7,198)
Total income tax expense from continuing operations..............................
.
$ 436,635 $ 371,314 $ 338,686
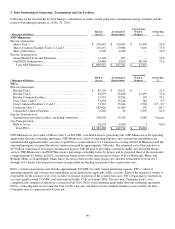
The components of Xcel Energy’s net deferred tax liability (current and noncurrent) at Dec. 31 were as follows:
(Thousands of Dollars) 2010 2009
Deferred tax liabilities:
Differences between book and tax bases of property ........................................ $ 3,853,425 $ 3,224,842
Regulatory assets ........................................................................ 242,760 232,887
Other ................................................................................... 219,035 198,912
Total deferred tax liabilities ............................................................ $ 4,315,220 $ 3,656,641
Deferred tax assets:
NOL carryforward ....................................................................... $ 423,728 $ 251,089
Tax credit carryforward .................................................................. 226,022 196,475
Unbilled revenue - fuel costs ............................................................. 69,358 62,056
Regulatory liabilities ..................................................................... 51,600 48,426
Environmental remediation ............................................................... 41,696 40,874
Deferred investment tax credits ........................................................... 39,916 39,968
Rate refund ............................................................................. 8,971 40,956
Accrued liabilities and other .............................................................. 58,891 43,507
Total deferred tax assets ................................................................ $ 920,182 $ 723,351
N
et deferred tax liability ................................................................... $ 3,395,038 $ 2,933,290