Xcel Energy 2010 Annual Report Download - page 67
Download and view the complete annual report
Please find page 67 of the 2010 Xcel Energy annual report below. You can navigate through the pages in the report by either clicking on the pages listed below, or by using the keyword search tool below to find specific information within the annual report.-
 1
1 -
2
-
3
-
4
-
5
-
6
-
7
-
8
-
9
-
10
-
11
-
12
-
13
-
14
-
15
-
16
-
17
-
18
-
19
-
20
-
21
-
22
-
23
-
24
-
25
-
26
-
27
-
28
-
29
-
30
-
31
-
32
-
33
-
34
-
35
-
36
-
37
-
38
-
39
-
40
-
41
-
42
-
43
-
44
-
45
-
46
-
47
-
48
-
49
-
50
-
51
-
52
-
53
-
54
-
55
-
56
-
 57
57 -
 58
58 -
 59
59 -
 60
60 -
 61
61 -
 62
62 -
 63
63 -
 64
64 -
 65
65 -
 66
66 -
 67
67 -
 68
68 -
 69
69 -
 70
70 -
 71
71 -
 72
72 -
 73
73 -
 74
74 -
 75
75 -
 76
76 -
 77
77 -
78
-
79
-
80
-
81
-
82
-
83
-
84
-
85
-
86
-
87
-
88
-
89
-
90
-
91
-
92
-
93
-
94
-
95
-
96
-
97
-
98
-
99
-
100
-
101
-
102
-
103
-
104
-
105
-
106
-
107
-
108
-
109
-
110
-
111
-
112
-
113
-
114
-
115
-
116
-
117
-
118
-
119
-
120
-
121
-
122
-
123
-
124
-
125
-
126
-
127
-
128
-
129
-
130
-
131
-
132
-
133
-
134
-
135
-
136
-
137
-
138
-
139
-
140
-
141
-
142
-
143
-
144
-
145
-
146
-
147
-
148
-
149
-
150
-
151
-
152
-
153
-
154
-
155
-
156
-
157
-
158
-
159
-
160
-
161
-
162
-
163
-
164
-
165
-
166
-
167
-
168
-
169
-
170
-
171
-
172
 |
 |

57
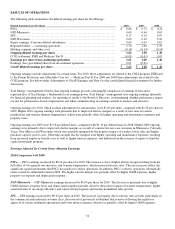
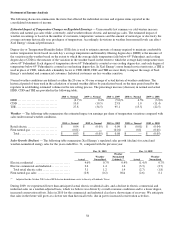
The following table provides a reconciliation of ongoing and GAAP earnings and earnings per diluted share for the years ended
Dec. 31:
(Millions of Dollars) 2010 2009 2008
Ongoing earnings ......................................................... $ 756.4 $ 690.0 $ 641.1
COLI settlement, PSRI and Medicare Part D ................................. (4.5) (4.5) 4.6
Total continuing operations ............................................... 751.9 685.5 645.7
Income (loss) from discontinued operations .................................. 3.9 (4.6) (0.1)
Total GAAP earnings ..................................................... $ 755.8 $ 680.9 $ 645.6
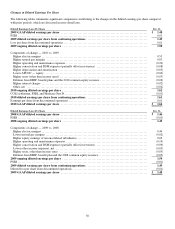
Diluted Earnings (Loss) Per Share 2010 2009 2008
Ongoing earnings per diluted share (a) ..................................... $ 1.62 $ 1.50 $ 1.45
COLI settlement, PSRI and Medicare Part D ................................. (0.01) (0.01) 0.01
Earnings per share — continuing operations (a) ............................ 1.61 1.49 1.46
Earnings (loss) from discontinued operations ................................. 0.01 (0.01)
—
Total GAAP earnings per diluted share (a) ................................. $ 1.62 $ 1.48 $ 1.46
(a) Includes the dividend requirements on preferred stock.
Continuing operations consist of the following:
● Regulated utility subsidiaries, operating in the electric and natural gas segments; and
● Other nonregulated subsidiaries and the holding company.
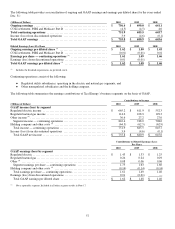
The following table summarizes the earnings contributions of Xcel Energy’s business segments on the basis of GAAP.
Contributions to Income
(Millions of Dollars) 2010 2009 2008
GAAP income (loss) by segment
Regulated electric income .................................................. $ 665.2 $ 611.9 $ 552.3
Regulated natural gas income ............................................... 114.6 108.9 129.3
Other income (a) ............................................................ 36.6 27.2 27.0
Segment income — continuing operations .................................. 816.4 748.0 708.6
Holding company and other costs (a) ......................................... (64.5) (62.5) (62.9)
Total income — continuing operations ..................................... 751.9 685.5 645.7
Income (loss) from discontinued operations .................................. 3.9 (4.6) (0.1)
Total GAAP net income .................................................. $ 755.8 $ 680.9 $ 645.6
Contributions to Diluted Earnings (Loss)
Per Share
2010 2009 2008
GAAP earnings (loss) by segment
Regulated electric .......................................................... $ 1.43 $ 1.33 $ 1.25
Regulated natural gas ....................................................... 0.24 0.24 0.29
Other (a) ................................................................... 0.08 0.06 0.06
Segment earnings per share — continuing operations ....................... 1.75 1.63 1.60
Holding company and other costs (a) ......................................... (0.14) (0.14) (0.14)
Total earnings per share — continuing operations ........................... 1.61 1.49 1.46
Earnings (loss) from discontinued operations ................................. 0.01 (0.01)
—
Total GAAP earnings per diluted share .................................... $ 1.62 $ 1.48 $ 1.46
(a) Not a reportable segment. Included in all other segment results in Note 17.