Xcel Energy 2010 Annual Report Download - page 114
Download and view the complete annual report
Please find page 114 of the 2010 Xcel Energy annual report below. You can navigate through the pages in the report by either clicking on the pages listed below, or by using the keyword search tool below to find specific information within the annual report.-
 1
1 -
2
-
3
-
4
-
5
-
6
-
7
-
8
-
9
-
10
-
11
-
12
-
13
-
14
-
15
-
16
-
17
-
18
-
19
-
20
-
21
-
22
-
23
-
24
-
25
-
26
-
27
-
28
-
29
-
30
-
31
-
32
-
33
-
34
-
35
-
36
-
37
-
38
-
39
-
40
-
41
-
42
-
43
-
44
-
45
-
46
-
47
-
48
-
49
-
50
-
51
-
52
-
53
-
54
-
55
-
56
-
57
-
58
-
59
-
60
-
61
-
62
-
63
-
64
-
65
-
66
-
67
-
68
-
69
-
70
-
71
-
72
-
73
-
74
-
75
-
76
-
77
-
78
-
79
-
80
-
81
-
82
-
83
-
84
-
85
-
86
-
87
-
88
-
89
-
90
-
91
-
92
-
93
-
94
-
95
-
96
-
97
-
98
-
99
-
100
-
101
-
102
-
103
-
 104
104 -
 105
105 -
 106
106 -
 107
107 -
 108
108 -
 109
109 -
 110
110 -
 111
111 -
 112
112 -
 113
113 -
 114
114 -
 115
115 -
 116
116 -
 117
117 -
 118
118 -
 119
119 -
 120
120 -
 121
121 -
 122
122 -
 123
123 -
 124
124 -
125
-
126
-
127
-
128
-
129
-
130
-
131
-
132
-
133
-
134
-
135
-
136
-
137
-
138
-
139
-
140
-
141
-
142
-
143
-
144
-
145
-
146
-
147
-
148
-
149
-
150
-
151
-
152
-
153
-
154
-
155
-
156
-
157
-
158
-
159
-
160
-
161
-
162
-
163
-
164
-
165
-
166
-
167
-
168
-
169
-
170
-
171
-
172
 |
 |

104
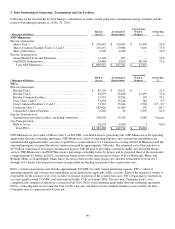
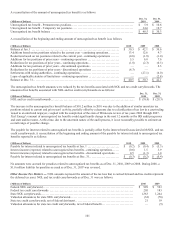
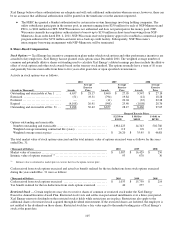
In 2010, 2009 and 2008, Xcel Energy had approximately 5.4 million, 7.6 million and 8.1 million weighted average options
outstanding, respectively, that were antidilutive, and therefore, excluded from the earnings per share calculation. The dilutive
impact of common stock equivalents affecting earnings per share was as follows for the years ending Dec. 31:
2010 2009 2008
(Amounts in thousands,
except per share data) Income Shares
Per
Share
Amount Income Shares
Per
Share
Amount Income Shares
Per
Share
Amount
N
et income .................... $ 755,834 $ 680,887 $ 645,554
Less: Dividend requirements on
preferred stock ............... (4,241) (4,241) (4,241)
Basic earnings per share:
Earnings available to common
shareholders ................. 751,593 462,052 $ 1.63 676,646 456,433 $ 1.48 641,313 437,054 $ 1.47
Effect of dilutive securities:
Equity forward instruments ....
—
700
—
—
—
—
Convertible senior notes .......
—
—
—
—
4,498 4,144
401(k) equity awards..........
—
639
—
705
—
596
Stock options.................
—
—
—
1
—
19
Diluted earnings per share:
Earnings available to common
shareholders and assumed
conversions .................. $ 751,593 463,391 $ 1.62 $ 676,646 457,139 $ 1.48 $ 645,811 441,813 $ 1.46
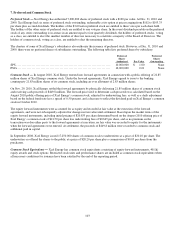
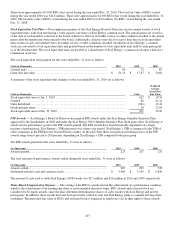
Common Stock Dividends Per Share — Historically, Xcel Energy has paid quarterly dividends to its shareholders. Dividends on
common stock are paid as declared by the Board of Directors. Dividends declared per share for the quarters of 2010, 2009 and
2008 were:
Dividends Per Share 2010 2009 2008
First quarter ................................................................. $ 0.2450 $ 0.2375 $ 0.2300
Second quarter .............................................................. 0.2525 0.2450 0.2375
Third quarter ................................................................ 0.2525 0.2450 0.2375
Fourth quarter ............................................................... 0.2525 0.2450 0.2375
$ 1.0025 $ 0.9725 $ 0.9425
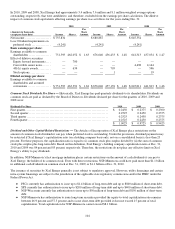
Dividend and Other Capital-Related Restrictions — The Articles of Incorporation of Xcel Energy place restrictions on the
amount of common stock dividends it can pay when preferred stock is outstanding. Under the provisions, dividend payments may
be restricted if Xcel Energy’s capitalization ratio (on a holding company basis only, not on a consolidated basis) is less than 25
percent. For these purposes, the capitalization ratio is equal to (i) common stock plus surplus divided by (ii) the sum of common
stock plus surplus plus long-term debt. Based on this definition, Xcel Energy’s holding company capitalization ratio at Dec. 31,
2010 and 2009 was 84 percent and 85 percent, respectively. Therefore, the restrictions do not place any effective limit on Xcel
Energy’s ability to pay dividends.
In addition, NSP-Minnesota’s first mortgage indenture places certain restrictions on the amount of cash dividends it can pay to
Xcel Energy, the holder of its common stock. Even with these restrictions, NSP-Minnesota could have paid more than $1.1 billion
in additional cash dividends on common stock at Dec. 31, 2009, or $1.1 billion at Dec. 31, 2010.
The issuance of securities by Xcel Energy generally is not subject to regulatory approval. However, utility financings and certain
intra-system financings are subject to the jurisdiction of the applicable state regulatory commissions and/or the FERC under the
Federal Power Act.
● PSCo currently has authorization to issue up to $1.4 billion of long-term debt and up to $800 million of short-term debt.
● SPS currently has authorization to issue up to $200 million of long-term debt and up to $400 million of short-term debt.
● NSP-Wisconsin currently has authorization to issue up to $50 million of long-term debt and $150 million of short-term
debt.
● NSP-Minnesota has authorization to issue long-term securities provided the equity-to-total capitalization ratio remains
between 46.9 percent and 57.3 percent and to issue short-term debt provided it does not exceed 15 percent of total
capitalization. Total capitalization for NSP-Minnesota cannot exceed $8.1 billion.