Xcel Energy 2010 Annual Report Download - page 74
Download and view the complete annual report
Please find page 74 of the 2010 Xcel Energy annual report below. You can navigate through the pages in the report by either clicking on the pages listed below, or by using the keyword search tool below to find specific information within the annual report.-
 1
1 -
2
-
3
-
4
-
5
-
6
-
7
-
8
-
9
-
10
-
11
-
12
-
13
-
14
-
15
-
16
-
17
-
18
-
19
-
20
-
21
-
22
-
23
-
24
-
25
-
26
-
27
-
28
-
29
-
30
-
31
-
32
-
33
-
34
-
35
-
36
-
37
-
38
-
39
-
40
-
41
-
42
-
43
-
44
-
45
-
46
-
47
-
48
-
49
-
50
-
51
-
52
-
53
-
54
-
55
-
56
-
57
-
58
-
59
-
60
-
61
-
62
-
63
-
 64
64 -
 65
65 -
 66
66 -
 67
67 -
 68
68 -
 69
69 -
 70
70 -
 71
71 -
 72
72 -
 73
73 -
 74
74 -
 75
75 -
 76
76 -
 77
77 -
 78
78 -
 79
79 -
 80
80 -
 81
81 -
 82
82 -
 83
83 -
 84
84 -
85
-
86
-
87
-
88
-
89
-
90
-
91
-
92
-
93
-
94
-
95
-
96
-
97
-
98
-
99
-
100
-
101
-
102
-
103
-
104
-
105
-
106
-
107
-
108
-
109
-
110
-
111
-
112
-
113
-
114
-
115
-
116
-
117
-
118
-
119
-
120
-
121
-
122
-
123
-
124
-
125
-
126
-
127
-
128
-
129
-
130
-
131
-
132
-
133
-
134
-
135
-
136
-
137
-
138
-
139
-
140
-
141
-
142
-
143
-
144
-
145
-
146
-
147
-
148
-
149
-
150
-
151
-
152
-
153
-
154
-
155
-
156
-
157
-
158
-
159
-
160
-
161
-
162
-
163
-
164
-
165
-
166
-
167
-
168
-
169
-
170
-
171
-
172
 |
 |

64
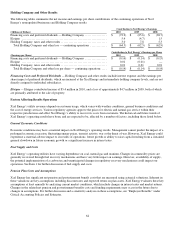
Holding Company and Other Results
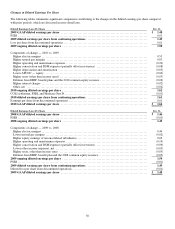
The following tables summarize the net income and earnings per share contributions of the continuing operations of Xcel
Energy’s nonregulated businesses and Holding Company results:
Contribution to Xcel Energy’s Earnings
(Millions of Dollars) 2010 2009 2008
Financing costs and preferred dividends — Holding Company ................. $ (72.9) $ (65.6) $ (69.7)
Eloigne ................................................................... 5.4 (4.7) 1.5
Holding Company, taxes and other results .................................... 3.0 7.8 5.3
Total Holding Company and other loss — continuing operations ............. $ (64.5) $ (62.5) $ (62.9)
Contribution to Xcel Energy’s Earnings per Share
(Earnings per Share) 2010 2009 2008
Financing costs and preferred dividends — Holding Company ................. $ (0.16) $ (0.14) $ (0.15)
Eloigne ................................................................... 0.01 (0.01)
—
Holding Company, taxes and other results .................................... 0.01 0.01 0.01
Total Holding Company and other loss per share — continuing operations .... $ (0.14) $ (0.14) $ (0.14)
Financing Costs and Preferred Dividends — Holding Company and other results include interest expense and the earnings per
share impact of preferred dividends, which are incurred at the Xcel Energy and intermediate holding company levels, and are not
directly assigned to individual subsidiaries.
Eloigne — Eloigne contributed income of $5.4 million in 2010, and a loss of approximately $4.7 million in 2009, both of which
are primarily attributed to the sale of property.
Factors Affecting Results Operations
Xcel Energy’s utility revenues depend on customer usage, which varies with weather conditions, general business conditions and
the cost of energy services. Various regulatory agencies approve the prices for electric and natural gas service within their
respective jurisdictions and affect Xcel Energy’s ability to recover its costs from customers. The historical and future trends of
Xcel Energy’s operating results have been, and are expected to be, affected by a number of factors, including those listed below.
General Economic Conditions
Economic conditions may have a material impact on Xcel Energy’s operating results. Management cannot predict the impact of a
prolonged economic recession, fluctuating energy prices, terrorist activity, war or the threat of war. However, Xcel Energy could
experience a material adverse impact to its results of operations, future growth or ability to raise capital resulting from a sustained
general slowdown in future economic growth or a significant increase in interest rates.
Fuel Supply and Costs
Xcel Energy’s operating utilities have varying dependence on coal, natural gas and uranium. Changes in commodity prices are
generally recovered through fuel recovery mechanisms and have very little impact on earnings. However, availability of supply,
the potential implementation of a carbon tax and unanticipated changes in regulatory recovery mechanisms could impact our
operations. See Item 1 for further discussion of fuel supply and costs.
Pension Plan Costs and Assumptions
Xcel Energy has significant net pension and postretirement benefit costs that are measured using actuarial valuations. Inherent in
these valuations are key assumptions including discount rates and expected return on plan assets. Xcel Energy evaluates these key
assumptions at least annually by analyzing current market conditions, which include changes in interest rates and market returns.
Changes in the related net pension and postretirement benefits costs and funding requirements may occur in the future due to
changes in assumptions. For further discussion and a sensitivity analysis on these assumptions, see “Employee Benefits” under
Critical Accounting Policies and Estimates.