Xcel Energy 2010 Annual Report Download - page 131
Download and view the complete annual report
Please find page 131 of the 2010 Xcel Energy annual report below. You can navigate through the pages in the report by either clicking on the pages listed below, or by using the keyword search tool below to find specific information within the annual report.-
 1
1 -
2
-
3
-
4
-
5
-
6
-
7
-
8
-
9
-
10
-
11
-
12
-
13
-
14
-
15
-
16
-
17
-
18
-
19
-
20
-
21
-
22
-
23
-
24
-
25
-
26
-
27
-
28
-
29
-
30
-
31
-
32
-
33
-
34
-
35
-
36
-
37
-
38
-
39
-
40
-
41
-
42
-
43
-
44
-
45
-
46
-
47
-
48
-
49
-
50
-
51
-
52
-
53
-
54
-
55
-
56
-
57
-
58
-
59
-
60
-
61
-
62
-
63
-
64
-
65
-
66
-
67
-
68
-
69
-
70
-
71
-
72
-
73
-
74
-
75
-
76
-
77
-
78
-
79
-
80
-
81
-
82
-
83
-
84
-
85
-
86
-
87
-
88
-
89
-
90
-
91
-
92
-
93
-
94
-
95
-
96
-
97
-
98
-
99
-
100
-
101
-
102
-
103
-
104
-
105
-
106
-
107
-
108
-
109
-
110
-
111
-
112
-
113
-
114
-
115
-
116
-
117
-
118
-
119
-
120
-
 121
121 -
 122
122 -
 123
123 -
 124
124 -
 125
125 -
 126
126 -
 127
127 -
 128
128 -
 129
129 -
 130
130 -
 131
131 -
 132
132 -
 133
133 -
 134
134 -
 135
135 -
 136
136 -
 137
137 -
 138
138 -
 139
139 -
 140
140 -
 141
141 -
142
-
143
-
144
-
145
-
146
-
147
-
148
-
149
-
150
-
151
-
152
-
153
-
154
-
155
-
156
-
157
-
158
-
159
-
160
-
161
-
162
-
163
-
164
-
165
-
166
-
167
-
168
-
169
-
170
-
171
-
172
 |
 |

121
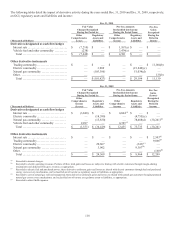
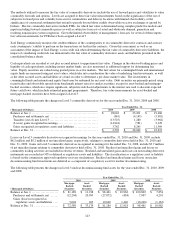
Xcel Energy recognizes transfers between Levels as of the beginning of each period. The following table presents the transfers
that occurred from Level 3 to Level 2 during the year ended Dec. 31, 2010.
(Thousands of Dollars) Year Ended
Dec. 31, 2010
Trading commodity derivatives not designated as cash flow hedges:
Current assets .................................................................................... $ 7,271
Noncurrent assets ................................................................................ 26,438
Current liabilities ................................................................................ (4,115)
Noncurrent liabilities ............................................................................. (16,069)
Total .......................................................................................... $ 13,525
There were no transfers of amounts from Level 2 to Level 3, or any transfers to or from Level 1 for the year ended Dec. 31,
2010. The transfer of amounts from Level 3 to Level 2 is due to the valuation of certain long-term derivative contracts for which
observable commodity pricing forecasts became a more significant input during the period.
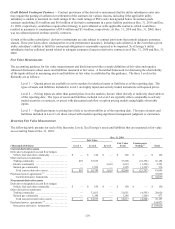
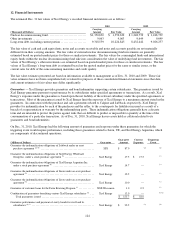
The following table presents for each of the hierarchy Levels, Xcel Energy’s assets and liabilities that are measured at fair value
on a recurring basis at Dec. 31, 2009:
Dec. 31, 2009
Fair Value
(Thousands of Dollars) Level 1 Level 2 Level 3 Fair Value
Total
Counterparty
Netting (c) Total
Current derivative assets
Other derivative instruments:
Trading commodity .................. $
—
$ 16,128 $ 7,241 $ 23,369 $ (13,763) $ 9,606
Electric commodity ..................
—
—
23,540 23,540 1,425 24,965
Natural gas commodity ...............
—
10,921
—
10,921 165 11,086
Total current derivative assets ....... $
—
$ 27,049 $ 30,781 $ 57,830 $ (12,173) 45,657
Purchased power agreements (b) ......... 52,043
Current derivative instruments ...... $ 97,700
Noncurrent derivative assets
Derivatives designated as cash flow
hedges:
Vehicle fuel and other commodity ..... $
—
$154 $
—
$ 154 $
—
$ 154
Other derivative instruments:
Trading commodity ..................
—
8,554 13,145 21,699 (3,516) 18,183
Natural gas commodity ...............
—
527
—
527 254 781
Total noncurrent derivative assets ... $
—
$ 9,235 $ 13,145 $ 22,380 $ (3,262) 19,118
Purchased power agreements (b) ......... 270,412
Noncurrent derivative instruments ..... $289,530