Xcel Energy 2010 Annual Report Download - page 64
Download and view the complete annual report
Please find page 64 of the 2010 Xcel Energy annual report below. You can navigate through the pages in the report by either clicking on the pages listed below, or by using the keyword search tool below to find specific information within the annual report.-
 1
1 -
2
-
3
-
4
-
5
-
6
-
7
-
8
-
9
-
10
-
11
-
12
-
13
-
14
-
15
-
16
-
17
-
18
-
19
-
20
-
21
-
22
-
23
-
24
-
25
-
26
-
27
-
28
-
29
-
30
-
31
-
32
-
33
-
34
-
35
-
36
-
37
-
38
-
39
-
40
-
41
-
42
-
43
-
44
-
45
-
46
-
47
-
48
-
49
-
50
-
51
-
52
-
53
-
 54
54 -
 55
55 -
 56
56 -
 57
57 -
 58
58 -
 59
59 -
 60
60 -
 61
61 -
 62
62 -
 63
63 -
 64
64 -
 65
65 -
 66
66 -
 67
67 -
 68
68 -
 69
69 -
 70
70 -
 71
71 -
 72
72 -
 73
73 -
 74
74 -
75
-
76
-
77
-
78
-
79
-
80
-
81
-
82
-
83
-
84
-
85
-
86
-
87
-
88
-
89
-
90
-
91
-
92
-
93
-
94
-
95
-
96
-
97
-
98
-
99
-
100
-
101
-
102
-
103
-
104
-
105
-
106
-
107
-
108
-
109
-
110
-
111
-
112
-
113
-
114
-
115
-
116
-
117
-
118
-
119
-
120
-
121
-
122
-
123
-
124
-
125
-
126
-
127
-
128
-
129
-
130
-
131
-
132
-
133
-
134
-
135
-
136
-
137
-
138
-
139
-
140
-
141
-
142
-
143
-
144
-
145
-
146
-
147
-
148
-
149
-
150
-
151
-
152
-
153
-
154
-
155
-
156
-
157
-
158
-
159
-
160
-
161
-
162
-
163
-
164
-
165
-
166
-
167
-
168
-
169
-
170
-
171
-
172
 |
 |

54
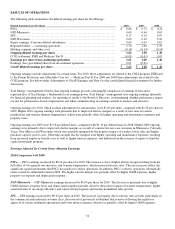
RESULTS OF OPERATIONS
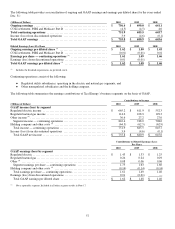
The following table summarizes the diluted earnings per share for Xcel Energy:
Diluted Earnings (Loss) Per Share 2010 2009 2008
PSCo ............................................................................ $ 0.86 $ 0.72 $ 0.76
N
SP-Minnesota ................................................................... 0.60 0.64 0.65
SPS .............................................................................. 0.17 0.15 0.07
N
SP-Wisconsin ................................................................... 0.09 0.10 0.10
Equity earnings of unconsolidated subsidiaries ...................................... 0.04 0.03 0.01
Regulated utility — continuing operations ........................................... 1.76 1.64 1.59
Holding company and other costs .................................................. (0.14) (0.14) (0.14)
Ongoing diluted earnings per share ............................................... 1.62 1.50 1.45
COLI settlement, PSRI and Medicare Part D ........................................ (0.01) (0.01) 0.01
Earnings per share from continuing operations ................................... 1.61 1.49 1.46
Earnings (loss) per diluted share from discontinued operations ........................ 0.01 (0.01)
—
GAAP diluted earnings per share ................................................. $1.62 $ 1.48 $1.46
Ongoing earnings exclude adjustments for certain items. For 2010, these adjustments are related to the COLI program, PSRI and
to the Patient Protection and Affordable Care Act — Medicare Part D. For 2009 and 2008 these adjustments are related to the
COLI program. See below under Adjustments to GAAP Earnings and Note 6 to the consolidated financial statements for further
discussion.
Xcel Energy’s management believes that ongoing earnings provide a meaningful comparison of earnings results and is
representative of Xcel Energy’s fundamental core earnings power. Xcel Energy’s management uses ongoing earnings internally
for financial planning and analysis, for reporting of results to the Board of Directors, in determining whether performance targets
are met for performance-based compensation and when communicating its earnings outlook to analysts and investors.
Ongoing earnings for 2010, which exclude adjustments for certain items, were $1.62 per share, compared with $1.50 per share in
2009. Higher 2010 ongoing earnings were primarily due to improved electric margins as a result of new rates in various
jurisdictions and warmer summer temperatures, which were partially offset by higher operating and maintenance expenses and
property taxes.
Ongoing earnings for 2009 were $1.50 per diluted share, compared with $1.45 per diluted share in 2008. Higher 2009 ongoing
earnings were primarily due to improved electric margins as a result of constructive rate case outcomes in Minnesota, Colorado,
Texas, New Mexico and Wisconsin, which were partially mitigated by the negative impact of weather, lower sales and higher
purchase capacity power costs. Offsetting stronger electric margins were higher operating and maintenance expenses, resulting
from increased employee benefit costs as well as higher nuclear expenses, and dilution from the issuance of equity to fund the
capital investment program.
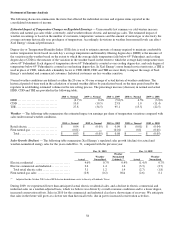
Earnings Adjusted for Certain Items (Ongoing Earnings)
2010 Comparison with 2009
PSCo — PSCo earnings increased by $0.14 per share for 2010. The increase is due to higher electric margin resulting from the
full effect of two general rate increases, and warmer temperatures, which increased electric sales. The rate increases reflect the
significant capital investments that PSCo has made in its utility operations. In addition, PSCo’s electric operations substantially
under-earned its authorized return in 2009. The higher electric margin was partially offset by higher O&M expenses, higher
property tax expense and depreciation expense.
NSP-Minnesota — NSP-Minnesota earnings decreased by $0.04 per share for 2010. The decrease is primarily due to higher
O&M expenses, property taxes and depreciation expense partially offset by the positive impact of warmer temperatures, higher
earned incentives on energy efficiency and conservation programs and modest normalized sales growth.
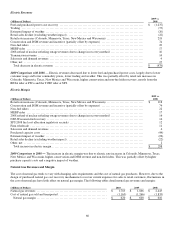
SPS — SPS earnings increased by $0.02 per share in 2010. The increase is primarily due to electric sales growth, particularly in
the commercial and industrial customer class, the reversal of previously established fuel reserves following the regulatory
approval of certain settlement agreements and lower interest expense, which was partially offset by higher O&M expenses.