Xcel Energy 2010 Annual Report Download - page 156
Download and view the complete annual report
Please find page 156 of the 2010 Xcel Energy annual report below. You can navigate through the pages in the report by either clicking on the pages listed below, or by using the keyword search tool below to find specific information within the annual report.-
 1
1 -
2
-
3
-
4
-
5
-
6
-
7
-
8
-
9
-
10
-
11
-
12
-
13
-
14
-
15
-
16
-
17
-
18
-
19
-
20
-
21
-
22
-
23
-
24
-
25
-
26
-
27
-
28
-
29
-
30
-
31
-
32
-
33
-
34
-
35
-
36
-
37
-
38
-
39
-
40
-
41
-
42
-
43
-
44
-
45
-
46
-
47
-
48
-
49
-
50
-
51
-
52
-
53
-
54
-
55
-
56
-
57
-
58
-
59
-
60
-
61
-
62
-
63
-
64
-
65
-
66
-
67
-
68
-
69
-
70
-
71
-
72
-
73
-
74
-
75
-
76
-
77
-
78
-
79
-
80
-
81
-
82
-
83
-
84
-
85
-
86
-
87
-
88
-
89
-
90
-
91
-
92
-
93
-
94
-
95
-
96
-
97
-
98
-
99
-
100
-
101
-
102
-
103
-
104
-
105
-
106
-
107
-
108
-
109
-
110
-
111
-
112
-
113
-
114
-
115
-
116
-
117
-
118
-
119
-
120
-
121
-
122
-
123
-
124
-
125
-
126
-
127
-
128
-
129
-
130
-
131
-
132
-
133
-
134
-
135
-
136
-
137
-
138
-
139
-
140
-
141
-
142
-
143
-
144
-
145
-
 146
146 -
 147
147 -
 148
148 -
 149
149 -
 150
150 -
 151
151 -
 152
152 -
 153
153 -
 154
154 -
 155
155 -
 156
156 -
 157
157 -
 158
158 -
 159
159 -
 160
160 -
 161
161 -
 162
162 -
 163
163 -
 164
164 -
 165
165 -
 166
166 -
167
-
168
-
169
-
170
-
171
-
172
 |
 |

146
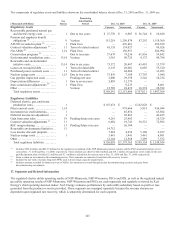
● Xcel Energy’ s regulated electric utility segment generates, transmits, and distributes electricity in Minnesota, Wisconsin,
Michigan, North Dakota, South Dakota, Colorado, Texas, and New Mexico. In addition, this segment includes sales for
resale and provides wholesale transmission service to various entities in the United States. Regulated electric utility also
includes commodity trading operations.
● Xcel Energy’ s regulated natural gas utility segment transports, stores and distributes natural gas primarily in portions of
Minnesota, Wisconsin, North Dakota, Michigan and Colorado.
● Revenues from operating segments not included above are below the necessary quantitative thresholds and are therefore
included in the all other category. Those primarily include steam revenue, appliance repair services, nonutility real estate
activities, revenues associated with processing solid waste into refuse-derived fuel and investments in rental housing
projects that qualify for low-income housing tax credits.
Xcel Energy had equity investments in unconsolidated subsidiaries of $97.6 million and $104.5 million as of Dec. 31, 2010 and
2009, respectively, included in the regulated natural gas segment.
Asset and capital expenditure information is not provided for Xcel Energy’ s reportable segments because as an integrated electric
and natural gas utility, Xcel Energy operates significant assets that are not dedicated to a specific business segment, and reporting
assets and capital expenditures by business segment would require arbitrary and potentially misleading allocations which may not
necessarily reflect the assets that would be required for the operation of the business segments on a stand-alone basis.
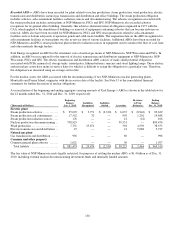
To report income from continuing operations for regulated electric and regulated natural gas utility segments the majority of costs
are directly assigned to each segment. However, some costs, such as common depreciation, common O&M expenses and interest
expense are allocated based on cost causation allocators. A general allocator is used for certain general and administrative
expenses, including office supplies, rent, property insurance and general advertising.
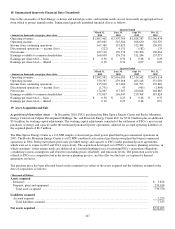
The accounting policies of the segments are the same as those described in Note 1 to the consolidated financial statements.
(Thousands of Dollars) Regulated
Electric Regulated
Natural Gas All
Other Reconciling
Eliminations Consolidated
Total
2010
Operating revenues from external customers . .. .. .. .... $ 8,451,845 $ 1,782,582 $ 76,520 $
—
$ 10,310,947
Intersegment revenues . .... .. .... ............ .... .. .. 1,015 5,653
—
(6,668)
—
Total revenues ... .... .. .... ..................... .. $ 8,452,860 $ 1,788,235 $ 76,520 $ (6,668) $ 10,310,947
Depreciation and amortization . .. ... .. .... ............ $ 748,815 $ 99,220 $ 10,847 $
—
$ 858,882
Interest charges and financing costs . .. .. .. .... .. .... .. 380,074 49,314 119,233
—
548,621
Income tax expense (benefit) . .. .......... .... .. ..... 434,756 59,790 (57,911 )
—
436,635
Income (loss) from continuing operations . .. .. .. ....... 665,155 114,554 (27,753 )
—
751,956
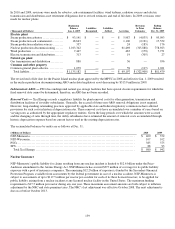
2009
Operating revenues from external customers . .. .. .. .... $ 7,704,723 $ 1,865,703 $ 73,877 $
—
$ 9,644,303
Intersegment revenues . .... .. .... ............ .... .. .. 816 2,931
—
(3,747)
—
Total revenues ... .... .. .... ..................... .. $ 7,705,539 $ 1,868,634 $ 73,877 $ (3,747) $ 9,644,303
Depreciation and amortization . .. ... .. .... ............ $ 711,090 $ 95,633 $ 11,329 $
—
$ 818,052
Interest charges and financing costs . .. .. .. .... .. .... .. 371,525 44,572 105,758
—
521,855
Income tax expense (benefit) . .. .......... .... .. ..... 357,128 81,956 (67,770 )
—
371,314
Income (loss) from continuing operations . .. .. .. ....... 611,851 108,948 (35,275 )
—
685,524
2008
Operating revenues from external customers . .. .. .. .... $ 8,682,993 $ 2,442,988 $ 77,175 $
—
$ 11,203,156
Intersegment revenues . .... .. .... ............ .... .. .. 973 6,793
—
(7,766)
—
Total revenues ... .... .. .... ..................... .. $ 8,683,966 $ 2,449,781 $ 77,175 $ (7,766) $ 11,203,156
Depreciation and amortization . .. ... .. .... ............ $ 715,695 $ 99,306 $ 13,378 $
—
$ 828,379
Interest charges and financing costs . .. .. .. .... .. .... .. 352,083 45,819 115,979
—
513,881
Income tax expense (benefit) . .. .......... .... .. ..... 345,543 73,647 (80,504 )
—
338,686
Income (loss) from continuing operations . .. .. .. ....... 552,300 129,298 (35,878 )
—
645,720
Given the similarity of the regulated electric and regulated natural gas utility operations of its utility subsidiaries, Xcel Energy has
the following reportable segments: regulated electric utility, regulated natural gas utility and all other.