Xcel Energy 2010 Annual Report Download - page 155
Download and view the complete annual report
Please find page 155 of the 2010 Xcel Energy annual report below. You can navigate through the pages in the report by either clicking on the pages listed below, or by using the keyword search tool below to find specific information within the annual report.-
 1
1 -
2
-
3
-
4
-
5
-
6
-
7
-
8
-
9
-
10
-
11
-
12
-
13
-
14
-
15
-
16
-
17
-
18
-
19
-
20
-
21
-
22
-
23
-
24
-
25
-
26
-
27
-
28
-
29
-
30
-
31
-
32
-
33
-
34
-
35
-
36
-
37
-
38
-
39
-
40
-
41
-
42
-
43
-
44
-
45
-
46
-
47
-
48
-
49
-
50
-
51
-
52
-
53
-
54
-
55
-
56
-
57
-
58
-
59
-
60
-
61
-
62
-
63
-
64
-
65
-
66
-
67
-
68
-
69
-
70
-
71
-
72
-
73
-
74
-
75
-
76
-
77
-
78
-
79
-
80
-
81
-
82
-
83
-
84
-
85
-
86
-
87
-
88
-
89
-
90
-
91
-
92
-
93
-
94
-
95
-
96
-
97
-
98
-
99
-
100
-
101
-
102
-
103
-
104
-
105
-
106
-
107
-
108
-
109
-
110
-
111
-
112
-
113
-
114
-
115
-
116
-
117
-
118
-
119
-
120
-
121
-
122
-
123
-
124
-
125
-
126
-
127
-
128
-
129
-
130
-
131
-
132
-
133
-
134
-
135
-
136
-
137
-
138
-
139
-
140
-
141
-
142
-
143
-
144
-
 145
145 -
 146
146 -
 147
147 -
 148
148 -
 149
149 -
 150
150 -
 151
151 -
 152
152 -
 153
153 -
 154
154 -
 155
155 -
 156
156 -
 157
157 -
 158
158 -
 159
159 -
 160
160 -
 161
161 -
 162
162 -
 163
163 -
 164
164 -
 165
165 -
166
-
167
-
168
-
169
-
170
-
171
-
172
 |
 |

145
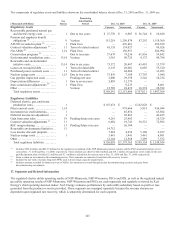
The components of regulatory assets and liabilities shown on the consolidated balance sheets at Dec. 31, 2010 and Dec. 31, 2009 are:
(Thousands of Dollars) See
Note(s)
Remaining
Amortization
Period Dec. 31, 2010 Dec. 31, 2009
Regulatory Assets Current Noncurrent Current Noncurrent
Recoverable purchased natural gas
and electric energy costs .. .. .. .... 1 One to two years $ 27,770 $ 9,907 $ 56,744 $ 10,620
Pension and employee benefit
obligations (a) .................... 9 Various 115,218 1,209,879 87,255 1,119,300
AFUDC recorded in plant (b) . .. .. ... 1 Plant lives
—
276,861
—
254,630
Contract valuation adjustments (c) .. . 11 Term of related contract 45,155 134,027
—
89,026
N
et AROs (d) ...................... 1,14 Plant lives
—
150,913
—
206,994
Conservation programs (b) .. .. ...... One to ten years 57,679 74,236 61,836 59,842
Environmental remediation costs . .... 13,14 Various 3,561 98,725 4,175 98,788
Renewable and environmental
initiative costs .. ....... ..... .... .. 13,14 One to six years 75,372 20,487 63,493 13,579
Losses on reacquired debt . .. .. .... .. 1 Term of related debt 6,319 49,001 6,685 55,320
Purchased power contracts costs . .... 11 Term of related contract
—
44,464
—
33,203
N
uclear outage costs . .. .. .. .. ..... .. 1,15 One to two years 33,819 7,169 57,707 3,040
Gas pipeline inspection costs .... .... Pending rate case 2,000 29,358 2,542 10,234
Depreciation differences .... .... .. .. 1 One to seven years 5,859 12,379
—
—
State commission adjustments (b) .... 1 Plant lives
—
9,235
—
8,401
Other ........ ............ .......... Various 15,789 24,819 16,574 24,392
Total regulatory assets .. ..... ..... 963,789,1$ 110,753 $ 064,151,2$ 145,883$
Regulatory Liabilities
Deferred electric, gas, and steam
production costs .... .. .... .. ...... $ 476,701$ 1
—
$ 142,828 $
—
Plant removal costs . ..... .... ....... 41,1
—
979,666 5,915 936,044
Investment tax credit deferrals .. .. .. . 1
—
65,856
—
65,884
Deferred income tax adjustment . .... 1
—
42,863
—
46,435
Gain from asset sales . .. .... .. ...... 19 Pending future rate cases 4,281 25,492
—
10,329
Contract valuation adjustments (c) .. . 298,27 125,83 347,91 486,6 11
REC margin sharing .... .......... .. 13 Pending future rate case
—
26,104
—
—
Renewable environmental initiative .. 257,41 31
—
—
—
Low income discount program . .. .... 710,2 061,5 230,4 260,7
N
uclear outage costs . .. .. .. .. ..... .. 188,6 144,3 144,3 144,3 1
Other ........ .. .... ................ 235,7 982,3 865,21 441,21
Total regulatory liabilities . .. .. .... 410,841,1$ 451,991 $ 567,971,1$ 830,651$
(a) Includes $392.4 million and $415.5 million for the regulatory recognition of the NSP-Minnesota pension expense and the PSCo unamortized prior service
costs at Dec. 31, 2010 and Dec. 31, 2009, respectively. These amounts are offset by $20.4 million and $18.1 million of regulatory assets related to the non-
qualified pension plan of which $2.2 million and $2.1 million is included in the current asset at Dec. 31, 2010 and Dec. 31, 2009, respectively.
(b) Earns a return on investment in the ratemaking process. These amounts are amortized consistent with recovery in rates.
(c) Includes the fair value of certain long-term PPAs used to meet energy capacity requirements.
(d) Includes amounts recorded for future recovery of AROs, less amounts recovered through nuclear decommissioning accruals and gains from
decommissioning investments.
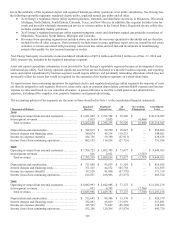
17. Segments and Related Information
The regulated electric utility operating results of NSP-Minnesota, NSP-Wisconsin, PSCo and SPS, as well as the regulated natural
gas utility operating results of NSP-Minnesota, NSP-Wisconsin and PSCo are each separately and regularly reviewed by Xcel
Energy’ s chief operating decision maker. Xcel Energy evaluates performance by each utility subsidiary based on profit or loss
generated from the product or service provided. These segments are managed separately because the revenue streams are
dependent upon regulated rate recovery, which is separately determined for each segment.
Given the similarity of the regulated electric and regulated natural gas utility operations of its utility subsidiaries, Xcel Energy has
the following reportable segments: regulated electric utility, regulated natural gas utility and all other.