Xcel Energy 2010 Annual Report Download - page 83
Download and view the complete annual report
Please find page 83 of the 2010 Xcel Energy annual report below. You can navigate through the pages in the report by either clicking on the pages listed below, or by using the keyword search tool below to find specific information within the annual report.-
 1
1 -
2
-
3
-
4
-
5
-
6
-
7
-
8
-
9
-
10
-
11
-
12
-
13
-
14
-
15
-
16
-
17
-
18
-
19
-
20
-
21
-
22
-
23
-
24
-
25
-
26
-
27
-
28
-
29
-
30
-
31
-
32
-
33
-
34
-
35
-
36
-
37
-
38
-
39
-
40
-
41
-
42
-
43
-
44
-
45
-
46
-
47
-
48
-
49
-
50
-
51
-
52
-
53
-
54
-
55
-
56
-
57
-
58
-
59
-
60
-
61
-
62
-
63
-
64
-
65
-
66
-
67
-
68
-
69
-
70
-
71
-
72
-
 73
73 -
 74
74 -
 75
75 -
 76
76 -
 77
77 -
 78
78 -
 79
79 -
 80
80 -
 81
81 -
 82
82 -
 83
83 -
 84
84 -
 85
85 -
 86
86 -
 87
87 -
 88
88 -
 89
89 -
 90
90 -
 91
91 -
 92
92 -
 93
93 -
94
-
95
-
96
-
97
-
98
-
99
-
100
-
101
-
102
-
103
-
104
-
105
-
106
-
107
-
108
-
109
-
110
-
111
-
112
-
113
-
114
-
115
-
116
-
117
-
118
-
119
-
120
-
121
-
122
-
123
-
124
-
125
-
126
-
127
-
128
-
129
-
130
-
131
-
132
-
133
-
134
-
135
-
136
-
137
-
138
-
139
-
140
-
141
-
142
-
143
-
144
-
145
-
146
-
147
-
148
-
149
-
150
-
151
-
152
-
153
-
154
-
155
-
156
-
157
-
158
-
159
-
160
-
161
-
162
-
163
-
164
-
165
-
166
-
167
-
168
-
169
-
170
-
171
-
172
 |
 |

73
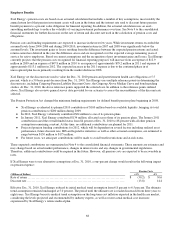
Commodity Derivatives — Xcel Energy continuously monitors the creditworthiness of the counterparties to its commodity
derivative contracts and assesses each counterparty’s ability to perform on the transactions set forth in the contracts. Given this
assessment and the typically short duration of these contracts, the impact of discounting commodity derivative assets for
counterparty credit risk was not material to the fair value of commodity derivative assets at Dec. 31, 2010. Adjustments to fair
value for credit risk of commodity trading instruments are recorded in electric revenues when necessary. Credit risk adjustments
for other commodity derivative instruments are deferred as OCI or regulatory assets and liabilities. The classification as a
regulatory asset or liability is based on commission approved regulatory recovery mechanisms. Xcel Energy also assesses the
impact of its own credit risk when determining the fair value of commodity derivative liabilities. The impact of discounting
commodity derivative liabilities for credit risk was immaterial to the fair value of commodity derivative liabilities at Dec. 31,
2010.
Commodity derivative assets and liabilities assigned to Level 3 consist primarily of FTRs, as well as forwards and options that are
either long-term in nature or related to commodities and delivery points with limited observability. Level 3 commodity derivative
assets represent an immaterial percentage of total assets measured at fair value at Dec. 31, 2010. Level 3 commodity derivative
liabilities represent 2.3 percent of total liabilities measured at fair value at Dec. 31, 2010.
Determining the fair value of FTRs requires numerous management forecasts that vary in observability, including various forward
commodity prices, retail and wholesale demand, generation and resulting transmission system congestion. Given the limited
observability of management’s forecasts for several of these inputs, these instruments have been assigned a Level 3. Level 3
commodity derivatives assets and liabilities include $3.6 million and $1.2 million of estimated fair values, respectively, for FTRs
held at Dec. 31, 2010.
Determining the fair value of certain commodity forwards and options can require management to make use of subjective forward
price and volatility forecasts for commodities and delivery locations with limited observability, or subjective forecasts which
extend to periods beyond those readily observable on active exchanges or quoted by brokers. When less observable forward price
and volatility forecasts are significant to determining the value of commodity forwards and options, these instruments are
assigned to Level 3.
There were no Level 3 commodity forwards or options held at Dec. 31, 2010.
Nuclear Decommissioning Fund — Nuclear decommissioning fund assets assigned to Level 3 consist of asset-backed and
mortgage-backed securities. To the extent appropriate, observable market inputs are utilized to estimate the fair value of these
securities; however, less observable and subjective inputs are often significant to these valuations, including risk-based
adjustments to the interest rate used to discount expected future cash flows, which include estimated prepayments of principal.
Therefore, estimated fair values for all asset-backed and mortgage-backed securities totaling $105.8 million in the nuclear
decommissioning fund at Dec. 31, 2010 (approximately 7.6 percent of total assets measured at fair value), are assigned to Level 3.
Realized and unrealized gains and losses on nuclear decommissioning fund investments are deferred as a component of a
regulatory asset for nuclear decommissioning.
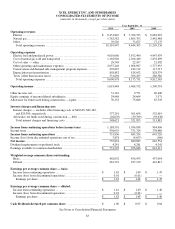
Liquidity and Capital Resources
Cash Flows
(Millions of Dollars) 2010 2009 2008
Cash provided by operating activities ...................................... $ 1,894 $ 1,913 $ 1,688
Cash provided by operating activities decreased by $19 million for 2010 as compared to 2009. The decrease is primarily due to
changes in working capital partially offset by higher net income and lower pension contributions made in 2010.
Cash provided by operating activities increased by $225 million for 2009 as compared to 2008. The increase was primarily
attributable to higher net income, changes in working capital due to the timing of accounts receivable, accounts payable and
inventory as a result of natural gas prices and an increase in plant-related deferred income taxes. The increase was partially offset
by increased pension contributions made in 2009 and higher AFUDC due primarily to the construction of Comanche Unit 3, a
power facility located in Colorado.
(Millions of Dollars) 2010 2009 2008
Cash used in investing activities ............................................ $ (2,807) $ (1,735) $ (2,157)