Xcel Energy 2010 Annual Report Download - page 89
Download and view the complete annual report
Please find page 89 of the 2010 Xcel Energy annual report below. You can navigate through the pages in the report by either clicking on the pages listed below, or by using the keyword search tool below to find specific information within the annual report.-
 1
1 -
2
-
3
-
4
-
5
-
6
-
7
-
8
-
9
-
10
-
11
-
12
-
13
-
14
-
15
-
16
-
17
-
18
-
19
-
20
-
21
-
22
-
23
-
24
-
25
-
26
-
27
-
28
-
29
-
30
-
31
-
32
-
33
-
34
-
35
-
36
-
37
-
38
-
39
-
40
-
41
-
42
-
43
-
44
-
45
-
46
-
47
-
48
-
49
-
50
-
51
-
52
-
53
-
54
-
55
-
56
-
57
-
58
-
59
-
60
-
61
-
62
-
63
-
64
-
65
-
66
-
67
-
68
-
69
-
70
-
71
-
72
-
73
-
74
-
75
-
76
-
77
-
78
-
 79
79 -
 80
80 -
 81
81 -
 82
82 -
 83
83 -
 84
84 -
 85
85 -
 86
86 -
 87
87 -
 88
88 -
 89
89 -
 90
90 -
 91
91 -
 92
92 -
 93
93 -
 94
94 -
 95
95 -
 96
96 -
 97
97 -
 98
98 -
 99
99 -
100
-
101
-
102
-
103
-
104
-
105
-
106
-
107
-
108
-
109
-
110
-
111
-
112
-
113
-
114
-
115
-
116
-
117
-
118
-
119
-
120
-
121
-
122
-
123
-
124
-
125
-
126
-
127
-
128
-
129
-
130
-
131
-
132
-
133
-
134
-
135
-
136
-
137
-
138
-
139
-
140
-
141
-
142
-
143
-
144
-
145
-
146
-
147
-
148
-
149
-
150
-
151
-
152
-
153
-
154
-
155
-
156
-
157
-
158
-
159
-
160
-
161
-
162
-
163
-
164
-
165
-
166
-
167
-
168
-
169
-
170
-
171
-
172
 |
 |
79
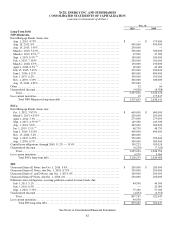
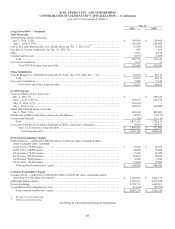
Long-Term Borrowings — See the Statement of Capitalization and a discussion of the long-term borrowings in Note 4 to the
consolidated financial statements.
Financing Plans — Xcel Energy issues debt and equity securities to refinance retiring maturities, reduce short-term debt, fund
construction programs, infuse equity in subsidiaries, fund asset acquisitions and for other general corporate purposes. In addition
to the periodic issuance and repayment of short-term debt, Xcel Energy and its utility subsidiaries’ financing plans are as follows:
● NSP-Minnesota may issue up to $300 million of first mortgage bonds during the second half of 2011.
● PSCo may issue approximately $250 million of first mortgage bonds during the second half of 2011.
● SPS may issue approximately $150 million of senior unsecured notes during the second half of 2011.
● Xcel Energy also anticipates issuing approximately $75 million of equity through the Dividend Reinvestment Program
and various benefit programs in 2011.
Financing plans are subject to change, depending on capital expenditures, internal cash generation, market conditions and other
factors.
Off-Balance-Sheet Arrangements
Xcel Energy does not have any off-balance-sheet arrangements, other than those currently disclosed, that have or are reasonably
likely to have a current or future effect on financial condition, changes in financial condition, revenues or expenses, results of
operations, liquidity, capital expenditures or capital resources that is material to investors.
Earnings Guidance
Xcel Energy’s 2011 ongoing earnings guidance is $1.65 to $1.75 per share. Key assumptions related to ongoing earnings are
detailed below:
● Normal weather patterns are experienced for the year.
● Weather-adjusted retail electric utility sales, adjusted for the sale of the Lubbock distribution assets, are projected to
grow approximately 1.0 to 1.3 percent.
● Weather-adjusted retail firm natural gas sales are projected to be relatively flat.
● Constructive outcomes in all rate case and regulatory proceedings.
● Rider revenue recovery is projected to increase approximately $35 million.
● O&M expenses are projected to increase approximately 4 percent.
● Depreciation expense is projected to increase $55 million to $65 million.
● Interest expense is projected to increase approximately $15 million to $25 million.
● AFUDC — equity is projected to be relatively flat.
● The effective tax rate is projected to be approximately 34 percent to 36 percent.
● Average common stock and equivalents are projected to be approximately 485 million shares.
Item 7A — Quantitative and Qualitative Disclosures About Market Risk
See Item 7, incorporated by reference.
Item 8 — Financial Statements and Supplementary Data
See Item 15-1 for an index of financial statements included herein.
See Note 18 to the consolidated financial statements for summarized quarterly financial data.