Xcel Energy 2010 Annual Report Download - page 69
Download and view the complete annual report
Please find page 69 of the 2010 Xcel Energy annual report below. You can navigate through the pages in the report by either clicking on the pages listed below, or by using the keyword search tool below to find specific information within the annual report.-
 1
1 -
2
-
3
-
4
-
5
-
6
-
7
-
8
-
9
-
10
-
11
-
12
-
13
-
14
-
15
-
16
-
17
-
18
-
19
-
20
-
21
-
22
-
23
-
24
-
25
-
26
-
27
-
28
-
29
-
30
-
31
-
32
-
33
-
34
-
35
-
36
-
37
-
38
-
39
-
40
-
41
-
42
-
43
-
44
-
45
-
46
-
47
-
48
-
49
-
50
-
51
-
52
-
53
-
54
-
55
-
56
-
57
-
58
-
 59
59 -
 60
60 -
 61
61 -
 62
62 -
 63
63 -
 64
64 -
 65
65 -
 66
66 -
 67
67 -
 68
68 -
 69
69 -
 70
70 -
 71
71 -
 72
72 -
 73
73 -
 74
74 -
 75
75 -
 76
76 -
 77
77 -
 78
78 -
 79
79 -
80
-
81
-
82
-
83
-
84
-
85
-
86
-
87
-
88
-
89
-
90
-
91
-
92
-
93
-
94
-
95
-
96
-
97
-
98
-
99
-
100
-
101
-
102
-
103
-
104
-
105
-
106
-
107
-
108
-
109
-
110
-
111
-
112
-
113
-
114
-
115
-
116
-
117
-
118
-
119
-
120
-
121
-
122
-
123
-
124
-
125
-
126
-
127
-
128
-
129
-
130
-
131
-
132
-
133
-
134
-
135
-
136
-
137
-
138
-
139
-
140
-
141
-
142
-
143
-
144
-
145
-
146
-
147
-
148
-
149
-
150
-
151
-
152
-
153
-
154
-
155
-
156
-
157
-
158
-
159
-
160
-
161
-
162
-
163
-
164
-
165
-
166
-
167
-
168
-
169
-
170
-
171
-
172
 |
 |

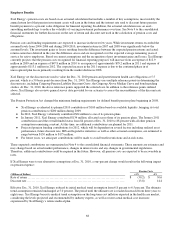
59
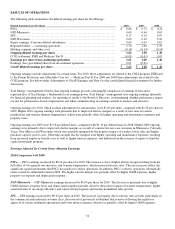
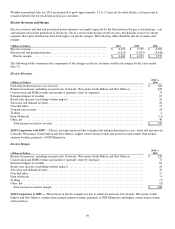
Weather-normalized sales for 2011 are projected to grow approximately 1.0 to 1.3 percent for retail electric customers and to
remain relatively flat for retail firm natural gas customers.
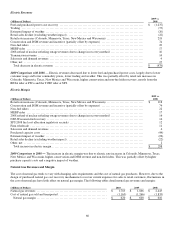
Electric Revenues and Margin
Electric revenues and fuel and purchased power expenses are largely impacted by the fluctuation in the price of natural gas, coal
and uranium used in the generation of electricity, but as a result of the design of fuel recovery mechanisms to recover current
expenses these price fluctuations have little impact on electric margin. The following tables detail the electric revenues and
margin:
(Millions of Dollars) 2010 2009 2008
Electric revenues ........................................................... $ 8,452 $ 7,705 $ 8,683
Electric fuel and purchased power ........................................... (4,011) (3,672) (4,948)
Electric margin .......................................................... $ 4,441 $ 4,033 $ 3,735
The following tables summarize the components of the changes in electric revenues and electric margin for the years ended
Dec. 31:
Electric Revenues
(Millions of Dollars) 2010 vs.
2009
Fuel and purchased power cost recovery .................................................................. $ 288
Retail rate increases, including seasonal rates (Colorado, Wisconsin, South Dakota and New Mexico) .......... 228
Conservation and DSM revenue and incentive (partially offset by expenses) ................................. 72
Estimated impact of weather ............................................................................. 65
Retail sales increase (excluding weather impact) ........................................................... 18
Sales mix and demand revenues .......................................................................... 16
N
on-fuel riders ......................................................................................... 15
Transmission revenue ................................................................................... 14
Trading ................................................................................................ 2
Firm wholesale ......................................................................................... (11)
Other, net .............................................................................................. 40
Total increase in electric revenue ....................................................................... $ 747
2010 Comparison with 2009 — Electric revenues increased due to higher fuel and purchased power costs, retail rate increases in
Colorado, Wisconsin, South Dakota and New Mexico, higher conservation revenue and incentives and warmer than normal
summer weather, primarily at NSP-Minnesota.
Electric Margin
(Millions of Dollars) 2010 vs.
2009
Retail rate increases, including seasonal rates (Colorado, Wisconsin, South Dakota and New Mexico) .......... $ 228
Conservation and DSM revenue and incentive (partially offset by expenses) ................................. 72
Estimated impact of weather ............................................................................. 65
Retail sales increase (excluding weather impact) ........................................................... 18
Sales mix and demand revenue ........................................................................... 16
N
on-fuel riders ......................................................................................... 15
Firm wholesale ......................................................................................... 9
Trading ................................................................................................ (7 )
Other, net .............................................................................................. (8 )
Total increase in electric margin ........................................................................ $ 408
2010 Comparison to 2009 — The increase in electric margin was due to retail rate increases in Colorado, Wisconsin, South
Dakota and New Mexico, warmer than normal summer weather, primarily at NSP-Minnesota and higher conservation revenue
and incentives.