Xcel Energy 2010 Annual Report Download - page 81
Download and view the complete annual report
Please find page 81 of the 2010 Xcel Energy annual report below. You can navigate through the pages in the report by either clicking on the pages listed below, or by using the keyword search tool below to find specific information within the annual report.-
 1
1 -
2
-
3
-
4
-
5
-
6
-
7
-
8
-
9
-
10
-
11
-
12
-
13
-
14
-
15
-
16
-
17
-
18
-
19
-
20
-
21
-
22
-
23
-
24
-
25
-
26
-
27
-
28
-
29
-
30
-
31
-
32
-
33
-
34
-
35
-
36
-
37
-
38
-
39
-
40
-
41
-
42
-
43
-
44
-
45
-
46
-
47
-
48
-
49
-
50
-
51
-
52
-
53
-
54
-
55
-
56
-
57
-
58
-
59
-
60
-
61
-
62
-
63
-
64
-
65
-
66
-
67
-
68
-
69
-
70
-
 71
71 -
 72
72 -
 73
73 -
 74
74 -
 75
75 -
 76
76 -
 77
77 -
 78
78 -
 79
79 -
 80
80 -
 81
81 -
 82
82 -
 83
83 -
 84
84 -
 85
85 -
 86
86 -
 87
87 -
 88
88 -
 89
89 -
 90
90 -
 91
91 -
92
-
93
-
94
-
95
-
96
-
97
-
98
-
99
-
100
-
101
-
102
-
103
-
104
-
105
-
106
-
107
-
108
-
109
-
110
-
111
-
112
-
113
-
114
-
115
-
116
-
117
-
118
-
119
-
120
-
121
-
122
-
123
-
124
-
125
-
126
-
127
-
128
-
129
-
130
-
131
-
132
-
133
-
134
-
135
-
136
-
137
-
138
-
139
-
140
-
141
-
142
-
143
-
144
-
145
-
146
-
147
-
148
-
149
-
150
-
151
-
152
-
153
-
154
-
155
-
156
-
157
-
158
-
159
-
160
-
161
-
162
-
163
-
164
-
165
-
166
-
167
-
168
-
169
-
170
-
171
-
172
 |
 |

71
Derivatives, Risk Management and Market Risk
In the normal course of business, Xcel Energy and its subsidiaries are exposed to a variety of market risks. Market risk is the
potential loss or gain that may occur as a result of changes in the market or fair value of a particular instrument or commodity. All
financial and commodity-related instruments, including derivatives, are subject to market risk. See Note 11 to the consolidated
financial statements for further discussion of market risks associated with derivatives.
Xcel Energy is exposed to the impact of changes in price for energy and energy related products, which is partially mitigated by
Xcel Energy’s use of commodity derivatives. Though no material non-performance risk currently exists with the counterparties to
Xcel Energy’s commodity derivative contracts, distress in the financial markets may in the future impact that risk to the extent it
impacts those counterparties. Distress in the financial markets may also impact the fair value of the debt and equity securities in
the nuclear decommissioning fund and master pension trust, as well as Xcel Energy’s ability to earn a return on short-term
investments of excess cash.
Commodity Price Risk — Xcel Energy’s utility subsidiaries are exposed to commodity price risk in their electric and natural gas
operations. Commodity price risk is managed by entering into long- and short-term physical purchase and sales contracts for
electric capacity, energy and energy-related products and for various fuels used in generation and distribution activities.
Commodity price risk is also managed through the use of financial derivative instruments. Xcel Energy’s risk management policy
allows it to manage commodity price risk within each rate-regulated operation to the extent such exposure exists.
Short-Term Wholesale and Commodity Trading Risk — Xcel Energy’s utility subsidiaries conduct various short-term wholesale
and commodity trading activities, including the purchase and sale of electric capacity, energy and energy-related instruments.
Xcel Energy’s risk management policy allows management to conduct these activities within guidelines and limitations as
approved by its risk management committee, which is made up of management personnel not directly involved in the activities
governed by this policy.
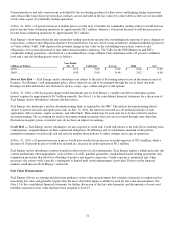
Changes in the fair value of commodity trading contracts before the impacts of margin-sharing mechanisms for the years ended
Dec. 31, were as follows:
(Thousands of Dollars) 2010 2009
Fair value of commodity trading net contract assets outstanding at Jan. 1 ............................ $ 9,628 $ 4,169
Contracts realized or settled during the period ....................................................... (4,449) (21,740)
Commodity trading contract additions and changes during period.................................
.
15,070 27,199
Fair value of commodity trading net contract assets outstanding at Dec. 31 ........................
.
$ 20,249 $ 9,628
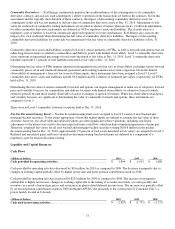
At Dec. 31, 2010, the fair values by source for the commodity trading net asset balance were as follows:
Futures / Forwards
(Thousands of Dollars) Source of
Fair Value
Maturity
Less Than
1 Year Maturity
1 to 3 Years Maturity
4 to 5 Years
Maturity
Greater Than
5 Years
Total
Futures/
Forwards
Fair Value
N
SP-Minnesota ....................
.
1 $ 5,914 $ 11,523 $ 976 $
—
$ 18,413
PSCo ..............................
.
1 573 1,245
—
—
1,818
$ 6,487 $ 12,768 $ 976 $
—
$ 20,231
Options
(Thousands of Dollars) Source of
Fair Value
Maturity
Less Than
1 Year Maturity
1 to 3 Years Maturity
4 to 5 Years
Maturity
Greater Than
5 Years Total Options
Fair Value
N
SP-Minnesota ....................
.
2 $ 18 $
—
$
—
$
—
$18
$18 $
—
$
—
$
—
$18
1 — Prices actively quoted or based on actively quoted prices.
2 — Prices based on models and other valuation methods. These represent the fair value of positions calculated using internal
models when directly and indirectly quoted external prices or prices derived from external sources are not available. Internal
models incorporate the use of options pricing and estimates of the present value of cash flows based upon underlying contractual
terms. The models reflect management’s estimates, taking into account observable market prices, estimated market prices in the
absence of quoted market prices, the risk-free market discount rate, volatility factors, estimated correlations of commodity prices
and contractual volumes. Market price uncertainty and other risks also are factored into the models.